Immigrants from Yemen vs Immigrants from Kuwait Unemployment Among Ages 30 to 34 years

COMPARE

Immigrants from Yemen
Race
Ancestry
AfghanAfricanAlaska NativeAlaskan AthabascanAlbanianAleutAlsatianAmericanApacheArabArapahoArgentineanArmenianAssyrian/Chaldean/SyriacAustralianAustrianBahamianBangladeshiBarbadianBasqueBelgianBelizeanBermudanBhutaneseBlackfeetBolivianBrazilianBritishBritish West IndianBulgarianBurmeseCajunCambodianCanadianCape VerdeanCarpatho RusynCelticCentral AmericanCentral American IndianCherokeeCheyenneChickasawChileanChineseChippewaChoctawColombianColvilleComancheCosta RicanCreeCreekCroatianCrowCubanCypriotCzechCzechoslovakianDanishDelawareDominicanDutchDutch West IndianEastern EuropeanEcuadorianEgyptianEnglishEstonianEthiopianEuropeanFijianFilipinoFinnishFrenchFrench American IndianFrench CanadianGermanGerman RussianGhanaianGreekGuamanian/ChamorroGuatemalanGuyaneseHaitianHmongHonduranHopiHoumaHungarianIcelanderIndian (Asian)IndonesianInupiatIranianIraqiIrishIroquoisIsraeliItalianJamaicanJapaneseJordanianKenyanKiowaKoreanLaotianLatvianLebaneseLiberianLithuanianLumbeeLuxembourgerMacedonianMalaysianMalteseMarshalleseMenomineeMexicanMexican American IndianMongolianMoroccanNative HawaiianNavajoNepaleseNew ZealanderNicaraguanNigerianNorthern EuropeanNorwegianOkinawanOsageOttawaPaiutePakistaniPalestinianPanamanianParaguayanPennsylvania GermanPeruvianPimaPolishPortuguesePotawatomiPuebloPuerto RicanPuget Sound SalishRomanianRussianSalvadoranSamoanScandinavianScotch-IrishScottishSeminoleSenegaleseSerbianShoshoneSierra LeoneanSiouxSlavicSlovakSloveneSomaliSouth AfricanSouth AmericanSouth American IndianSoviet UnionSpaniardSpanishSpanish AmericanSpanish American IndianSri LankanSubsaharan AfricanSudaneseSwedishSwissSyrianTaiwaneseThaiTlingit-HaidaTohono O'OdhamTonganTrinidadian and TobagonianTsimshianTurkishU.S. Virgin IslanderUgandanUkrainianUruguayanUteVenezuelanVietnameseWelshWest IndianYakamaYaquiYugoslavianYumanYup'ikZimbabwean
Immigration
NonimmigrantsImmigrantsAfghanistanAfricaAlbaniaArgentinaArmeniaAsiaAustraliaAustriaBahamasBangladeshBarbadosBelarusBelgiumBelizeBoliviaBosnia and HerzegovinaBrazilBulgariaBurma/MyanmarCabo VerdeCambodiaCameroonCanadaCaribbeanCentral AmericaChileChinaColombiaCongoCosta RicaCroatiaCubaCzechoslovakiaDenmarkDominicaDominican RepublicEastern AfricaEastern AsiaEastern EuropeEcuadorEgyptEl SalvadorEnglandEritreaEthiopiaEuropeFijiFranceGermanyGhanaGreeceGrenadaGuatemalaGuyanaHaitiHondurasHong KongHungaryIndiaIndonesiaIranIraqIrelandIsraelItalyJamaicaJapanJordanKazakhstanKenyaKoreaLaosLatin AmericaLatviaLebanonLiberiaLithuaniaMalaysiaMexicoMicronesiaMiddle AfricaMoldovaMoroccoNepalNetherlandsNicaraguaNigeriaNorth AmericaNorth MacedoniaNorthern AfricaNorthern EuropeNorwayOceaniaPakistanPanamaPeruPhilippinesPolandPortugalRomaniaRussiaSaudi ArabiaScotlandSenegalSerbiaSierra LeoneSingaporeSomaliaSouth AfricaSouth AmericaSouth Central AsiaSouth Eastern AsiaSouthern EuropeSpainSri LankaSt. Vincent and the GrenadinesSudanSwedenSwitzerlandSyriaTaiwanThailandTrinidad and TobagoTurkeyUgandaUkraineUruguayUzbekistanVenezuelaVietnamWest IndiesWestern AfricaWestern AsiaWestern EuropeYemenZaireZimbabweAzores
Immigrants from Kuwait
Race
Ancestry
AfghanAfricanAlaska NativeAlaskan AthabascanAlbanianAleutAlsatianAmericanApacheArabArapahoArgentineanArmenianAssyrian/Chaldean/SyriacAustralianAustrianBahamianBangladeshiBarbadianBasqueBelgianBelizeanBermudanBhutaneseBlackfeetBolivianBrazilianBritishBritish West IndianBulgarianBurmeseCajunCambodianCanadianCape VerdeanCarpatho RusynCelticCentral AmericanCentral American IndianCherokeeCheyenneChickasawChileanChineseChippewaChoctawColombianColvilleComancheCosta RicanCreeCreekCroatianCrowCubanCypriotCzechCzechoslovakianDanishDelawareDominicanDutchDutch West IndianEastern EuropeanEcuadorianEgyptianEnglishEstonianEthiopianEuropeanFijianFilipinoFinnishFrenchFrench American IndianFrench CanadianGermanGerman RussianGhanaianGreekGuamanian/ChamorroGuatemalanGuyaneseHaitianHmongHonduranHopiHoumaHungarianIcelanderIndian (Asian)IndonesianInupiatIranianIraqiIrishIroquoisIsraeliItalianJamaicanJapaneseJordanianKenyanKiowaKoreanLaotianLatvianLebaneseLiberianLithuanianLumbeeLuxembourgerMacedonianMalaysianMalteseMarshalleseMenomineeMexicanMexican American IndianMongolianMoroccanNative HawaiianNavajoNepaleseNew ZealanderNicaraguanNigerianNorthern EuropeanNorwegianOkinawanOsageOttawaPaiutePakistaniPalestinianPanamanianParaguayanPennsylvania GermanPeruvianPimaPolishPortuguesePotawatomiPuebloPuerto RicanPuget Sound SalishRomanianRussianSalvadoranSamoanScandinavianScotch-IrishScottishSeminoleSenegaleseSerbianShoshoneSierra LeoneanSiouxSlavicSlovakSloveneSomaliSouth AfricanSouth AmericanSouth American IndianSoviet UnionSpaniardSpanishSpanish AmericanSpanish American IndianSri LankanSubsaharan AfricanSudaneseSwedishSwissSyrianTaiwaneseThaiTlingit-HaidaTohono O'OdhamTonganTrinidadian and TobagonianTsimshianTurkishU.S. Virgin IslanderUgandanUkrainianUruguayanUteVenezuelanVietnameseWelshWest IndianYakamaYaquiYugoslavianYumanYup'ikZimbabwean
Immigration
NonimmigrantsImmigrantsAfghanistanAfricaAlbaniaArgentinaArmeniaAsiaAustraliaAustriaBahamasBangladeshBarbadosBelarusBelgiumBelizeBoliviaBosnia and HerzegovinaBrazilBulgariaBurma/MyanmarCabo VerdeCambodiaCameroonCanadaCaribbeanCentral AmericaChileChinaColombiaCongoCosta RicaCroatiaCubaCzechoslovakiaDenmarkDominicaDominican RepublicEastern AfricaEastern AsiaEastern EuropeEcuadorEgyptEl SalvadorEnglandEritreaEthiopiaEuropeFijiFranceGermanyGhanaGreeceGrenadaGuatemalaGuyanaHaitiHondurasHong KongHungaryIndiaIndonesiaIranIraqIrelandIsraelItalyJamaicaJapanJordanKazakhstanKenyaKoreaKuwaitLaosLatin AmericaLatviaLebanonLiberiaLithuaniaMalaysiaMexicoMicronesiaMiddle AfricaMoldovaMoroccoNepalNetherlandsNicaraguaNigeriaNorth AmericaNorth MacedoniaNorthern AfricaNorthern EuropeNorwayOceaniaPakistanPanamaPeruPhilippinesPolandPortugalRomaniaRussiaSaudi ArabiaScotlandSenegalSerbiaSierra LeoneSingaporeSomaliaSouth AfricaSouth AmericaSouth Central AsiaSouth Eastern AsiaSouthern EuropeSpainSri LankaSt. Vincent and the GrenadinesSudanSwedenSwitzerlandSyriaTaiwanThailandTrinidad and TobagoTurkeyUgandaUkraineUruguayUzbekistanVenezuelaVietnamWest IndiesWestern AfricaWestern AsiaWestern EuropeZaireZimbabweAzores
Unemployment Among Ages 30 to 34 years
Income
Poverty
Unemployment
Labor Participation
Family Structure
Vehicle Availability
Education Level
Disability

Unemployment Among Ages 30 to 34 years Comparison

Immigrants from Yemen

Immigrants from Kuwait

Tragic
Exceptional
7.3%
UNEMPLOYMENT AMONG AGES 30 TO 34 YEARS
0.0/ 100
METRIC RATING
323rd/ 347
METRIC RANK
5.0%
UNEMPLOYMENT AMONG AGES 30 TO 34 YEARS
99.5/ 100
METRIC RATING
26th/ 347
METRIC RANK

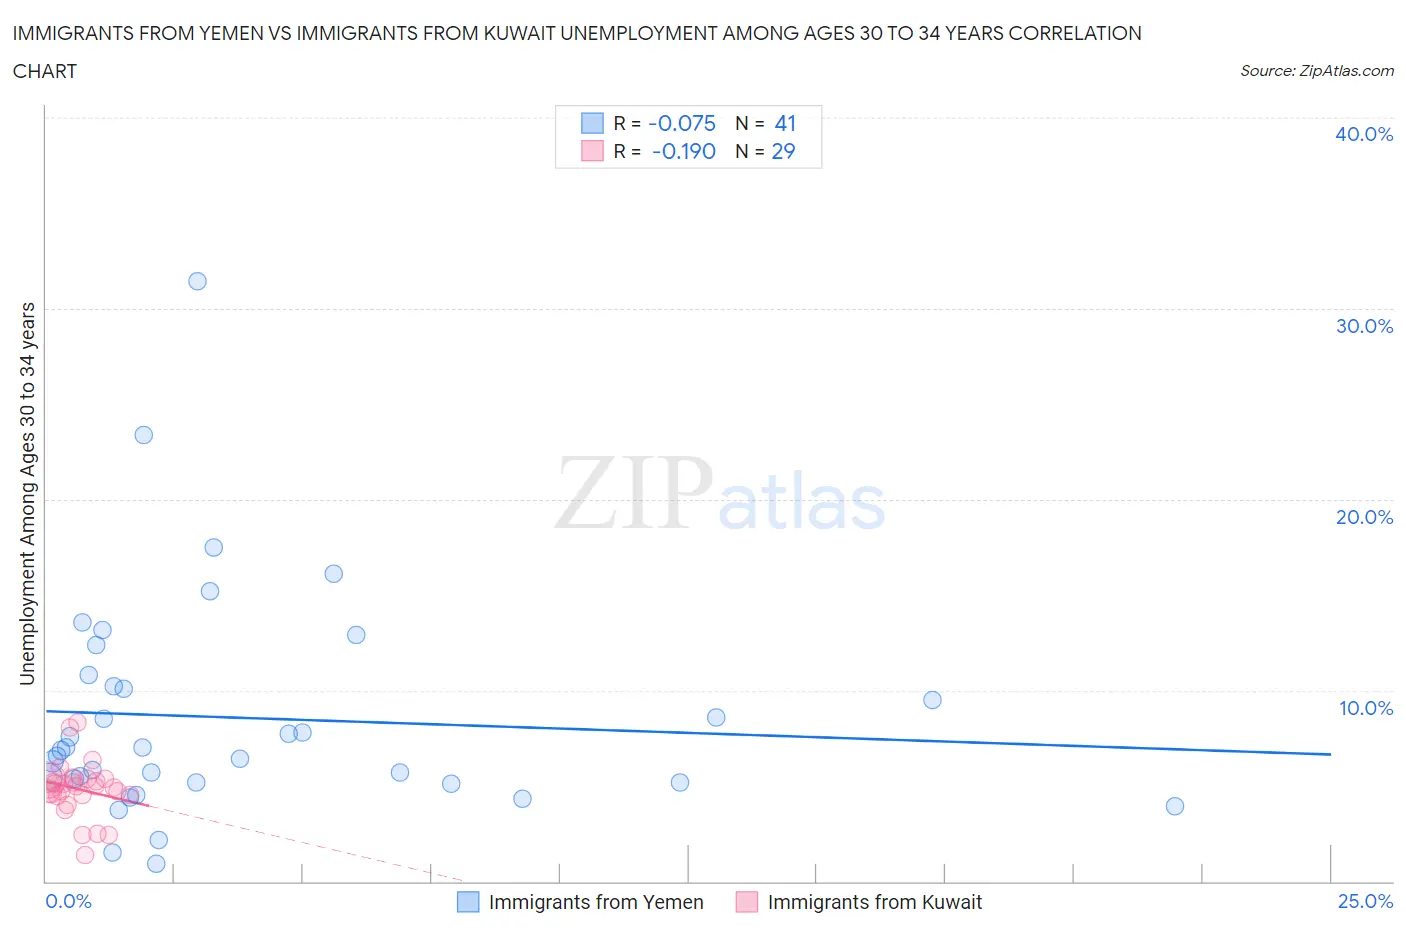
Immigrants from Yemen vs Immigrants from Kuwait Unemployment Among Ages 30 to 34 years Correlation Chart

The statistical analysis conducted on geographies consisting of 81,630,994 people shows a slight negative correlation between the proportion of Immigrants from Yemen and unemployment rate among population between the ages 30 and 34 in the United States with a correlation coefficient (R) of -0.075 and weighted average of 7.3%. Similarly, the statistical analysis conducted on geographies consisting of 134,713,450 people shows a poor negative correlation between the proportion of Immigrants from Kuwait and unemployment rate among population between the ages 30 and 34 in the United States with a correlation coefficient (R) of -0.190 and weighted average of 5.0%, a difference of 46.7%.
Immigrants from Yemen vs Immigrants from Kuwait Unemployment Among Ages 30 to 34 years

Unemployment Among Ages 30 to 34 years Correlation Summary

MeasurementImmigrants from YemenImmigrants from Kuwait
Minimum0.90%1.4%
Maximum31.4%8.3%
Range30.5%6.9%
Mean8.6%4.8%
Median6.8%5.0%
Interquartile 25% (IQ1)5.2%4.5%
Interquartile 75% (IQ3)10.5%5.4%
Interquartile Range (IQR)5.3%0.86%
Standard Deviation (Sample)5.9%1.5%
Standard Deviation (Population)5.8%1.4%

Similar Demographics by Unemployment Among Ages 30 to 34 years

Demographics Similar to Immigrants from Yemen by Unemployment Among Ages 30 to 34 years

In terms of unemployment among ages 30 to 34 years, the demographic groups most similar to Immigrants from Yemen are Marshallese (7.2%, a difference of 0.46%), Immigrants from Dominica (7.3%, a difference of 0.59%), Apache (7.3%, a difference of 0.86%), Immigrants from Guyana (7.2%, a difference of 0.96%), and Cape Verdean (7.2%, a difference of 1.3%).
DemographicsRating | RankUnemployment Among Ages 30 to 34 years
Houma
0.0
/100
|
#316
Tragic
7.2%
Immigrants | Cabo Verde
0.0
/100
|
#317
Tragic
7.2%
Blacks/African Americans
0.0
/100
|
#318
Tragic
7.2%
Guyanese
0.0
/100
|
#319
Tragic
7.2%
Cape Verdeans
0.0
/100
|
#320
Tragic
7.2%
Immigrants | Guyana
0.0
/100
|
#321
Tragic
7.2%
Marshallese
0.0
/100
|
#322
Tragic
7.2%
Immigrants | Yemen
0.0
/100
|
#323
Tragic
7.3%
Immigrants | Dominica
0.0
/100
|
#324
Tragic
7.3%
Apache
0.0
/100
|
#325
Tragic
7.3%
Dominicans
0.0
/100
|
#326
Tragic
7.7%
Immigrants | Dominican Republic
0.0
/100
|
#327
Tragic
7.7%
Chippewa
0.0
/100
|
#328
Tragic
7.8%
Cheyenne
0.0
/100
|
#329
Tragic
7.8%
Shoshone
0.0
/100
|
#330
Tragic
7.9%

Demographics Similar to Immigrants from Kuwait by Unemployment Among Ages 30 to 34 years

In terms of unemployment among ages 30 to 34 years, the demographic groups most similar to Immigrants from Kuwait are Danish (5.0%, a difference of 0.11%), Immigrants from Singapore (5.0%, a difference of 0.17%), Immigrants from Cuba (5.0%, a difference of 0.35%), German Russian (5.0%, a difference of 0.37%), and Norwegian (5.0%, a difference of 0.39%).
DemographicsRating | RankUnemployment Among Ages 30 to 34 years
Immigrants | Sudan
99.8
/100
|
#19
Exceptional
4.9%
Immigrants | Taiwan
99.8
/100
|
#20
Exceptional
4.9%
Ethiopians
99.8
/100
|
#21
Exceptional
4.9%
Immigrants | South Central Asia
99.8
/100
|
#22
Exceptional
4.9%
Hmong
99.8
/100
|
#23
Exceptional
4.9%
Ugandans
99.7
/100
|
#24
Exceptional
4.9%
Immigrants | Singapore
99.5
/100
|
#25
Exceptional
5.0%
Immigrants | Kuwait
99.5
/100
|
#26
Exceptional
5.0%
Danes
99.5
/100
|
#27
Exceptional
5.0%
Immigrants | Cuba
99.4
/100
|
#28
Exceptional
5.0%
German Russians
99.4
/100
|
#29
Exceptional
5.0%
Norwegians
99.4
/100
|
#30
Exceptional
5.0%
Somalis
99.3
/100
|
#31
Exceptional
5.0%
Immigrants | Zaire
99.3
/100
|
#32
Exceptional
5.0%
Immigrants | Saudi Arabia
99.3
/100
|
#33
Exceptional
5.0%