Immigrants from Yemen vs Arab Unemployment Among Youth under 25 years
COMPARE
Immigrants from Yemen
Arab
Unemployment Among Youth under 25 years
Unemployment Among Youth under 25 years Comparison
Immigrants from Yemen
Arabs
15.6%
UNEMPLOYMENT AMONG YOUTH UNDER 25 YEARS
0.0/ 100
METRIC RATING
329th/ 347
METRIC RANK
11.8%
UNEMPLOYMENT AMONG YOUTH UNDER 25 YEARS
18.0/ 100
METRIC RATING
200th/ 347
METRIC RANK
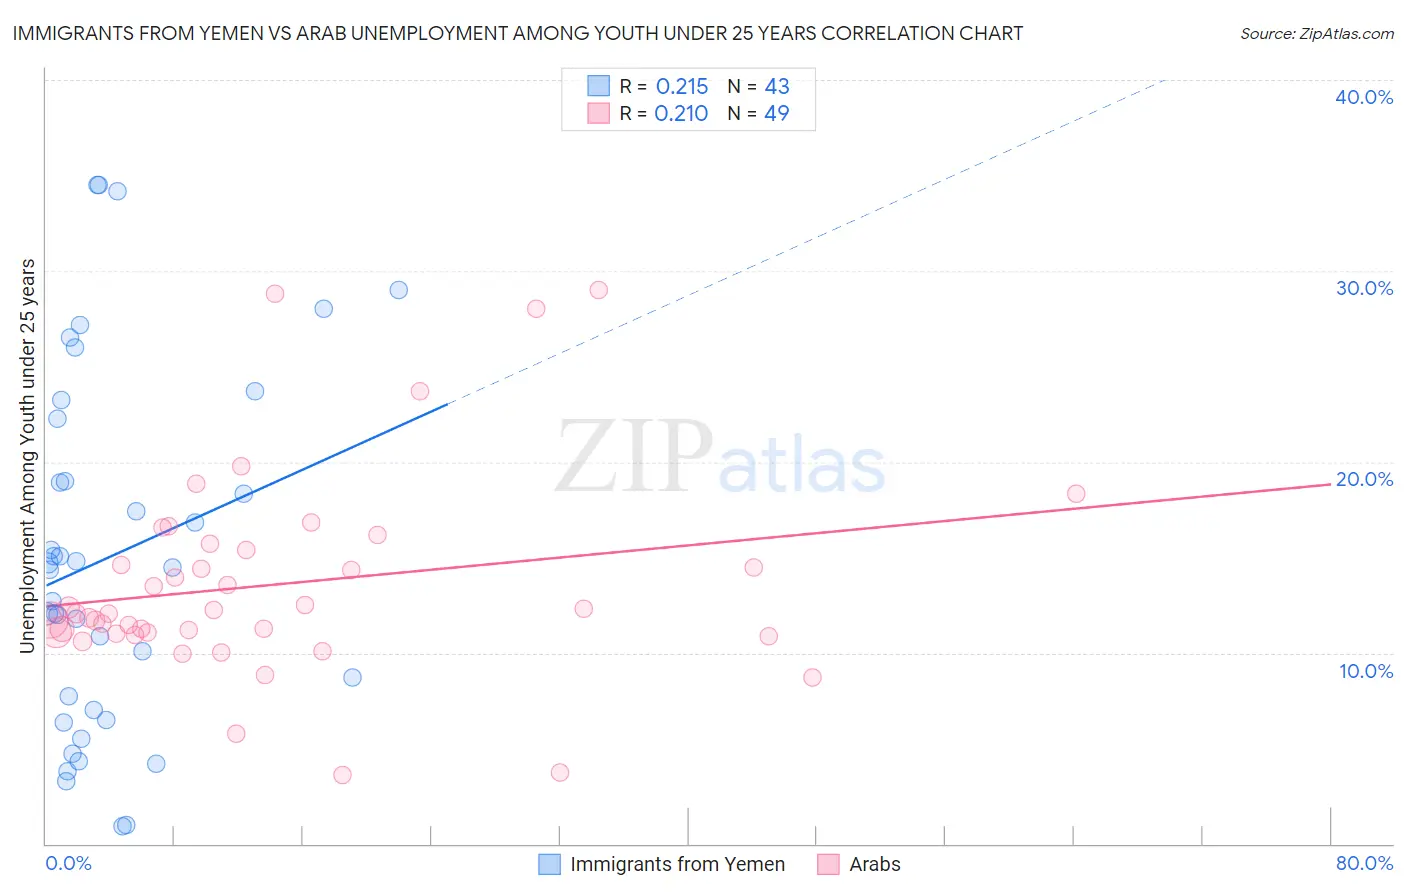
Immigrants from Yemen vs Arab Unemployment Among Youth under 25 years Correlation Chart
The statistical analysis conducted on geographies consisting of 82,337,548 people shows a weak positive correlation between the proportion of Immigrants from Yemen and unemployment rate among youth under the age of 25 in the United States with a correlation coefficient (R) of 0.215 and weighted average of 15.6%. Similarly, the statistical analysis conducted on geographies consisting of 478,049,168 people shows a weak positive correlation between the proportion of Arabs and unemployment rate among youth under the age of 25 in the United States with a correlation coefficient (R) of 0.210 and weighted average of 11.8%, a difference of 32.2%.
Unemployment Among Youth under 25 years Correlation Summary
| Measurement | Immigrants from Yemen | Arab |
| Minimum | 0.90% | 3.6% |
| Maximum | 34.5% | 29.0% |
| Range | 33.6% | 25.4% |
| Mean | 15.1% | 13.6% |
| Median | 14.5% | 12.0% |
| Interquartile 25% (IQ1) | 7.0% | 11.0% |
| Interquartile 75% (IQ3) | 22.3% | 15.6% |
| Interquartile Range (IQR) | 15.3% | 4.5% |
| Standard Deviation (Sample) | 9.3% | 5.3% |
| Standard Deviation (Population) | 9.2% | 5.3% |
Similar Demographics by Unemployment Among Youth under 25 years
Demographics Similar to Immigrants from Yemen by Unemployment Among Youth under 25 years
In terms of unemployment among youth under 25 years, the demographic groups most similar to Immigrants from Yemen are Yakama (15.6%, a difference of 0.040%), Immigrants from Dominican Republic (15.6%, a difference of 0.13%), British West Indian (15.5%, a difference of 0.24%), Dominican (15.7%, a difference of 0.87%), and Immigrants from Grenada (15.8%, a difference of 1.5%).
| Demographics | Rating | Rank | Unemployment Among Youth under 25 years |
| Trinidadians and Tobagonians | 0.0 /100 | #322 | Tragic 14.6% |
| Immigrants | Trinidad and Tobago | 0.0 /100 | #323 | Tragic 14.6% |
| Immigrants | Jamaica | 0.0 /100 | #324 | Tragic 14.8% |
| Alaska Natives | 0.0 /100 | #325 | Tragic 14.9% |
| Immigrants | Barbados | 0.0 /100 | #326 | Tragic 15.2% |
| British West Indians | 0.0 /100 | #327 | Tragic 15.5% |
| Immigrants | Dominican Republic | 0.0 /100 | #328 | Tragic 15.6% |
| Immigrants | Yemen | 0.0 /100 | #329 | Tragic 15.6% |
| Yakama | 0.0 /100 | #330 | Tragic 15.6% |
| Dominicans | 0.0 /100 | #331 | Tragic 15.7% |
| Immigrants | Grenada | 0.0 /100 | #332 | Tragic 15.8% |
| Guyanese | 0.0 /100 | #333 | Tragic 15.9% |
| Immigrants | Guyana | 0.0 /100 | #334 | Tragic 15.9% |
| Immigrants | St. Vincent and the Grenadines | 0.0 /100 | #335 | Tragic 16.1% |
| Pima | 0.0 /100 | #336 | Tragic 16.2% |
Demographics Similar to Arabs by Unemployment Among Youth under 25 years
In terms of unemployment among youth under 25 years, the demographic groups most similar to Arabs are Palestinian (11.8%, a difference of 0.15%), Marshallese (11.8%, a difference of 0.16%), Immigrants from Colombia (11.8%, a difference of 0.19%), Cherokee (11.8%, a difference of 0.20%), and Immigrants from Peru (11.8%, a difference of 0.20%).
| Demographics | Rating | Rank | Unemployment Among Youth under 25 years |
| Seminole | 27.9 /100 | #193 | Fair 11.7% |
| Immigrants | Sri Lanka | 27.8 /100 | #194 | Fair 11.7% |
| Paraguayans | 27.2 /100 | #195 | Fair 11.7% |
| Egyptians | 26.9 /100 | #196 | Fair 11.7% |
| Koreans | 23.9 /100 | #197 | Fair 11.7% |
| Cherokee | 21.2 /100 | #198 | Fair 11.8% |
| Immigrants | Colombia | 20.9 /100 | #199 | Fair 11.8% |
| Arabs | 18.0 /100 | #200 | Poor 11.8% |
| Palestinians | 16.0 /100 | #201 | Poor 11.8% |
| Marshallese | 15.8 /100 | #202 | Poor 11.8% |
| Immigrants | Peru | 15.3 /100 | #203 | Poor 11.8% |
| Immigrants | Costa Rica | 15.2 /100 | #204 | Poor 11.8% |
| Peruvians | 14.0 /100 | #205 | Poor 11.8% |
| Immigrants | Pakistan | 12.6 /100 | #206 | Poor 11.8% |
| Immigrants | Southern Europe | 12.3 /100 | #207 | Poor 11.8% |