Immigrants from Yemen vs Arab Male Unemployment
COMPARE
Immigrants from Yemen
Arab
Male Unemployment
Male Unemployment Comparison
Immigrants from Yemen
Arabs
7.8%
MALE UNEMPLOYMENT
0.0/ 100
METRIC RATING
329th/ 347
METRIC RANK
5.4%
MALE UNEMPLOYMENT
30.2/ 100
METRIC RATING
188th/ 347
METRIC RANK
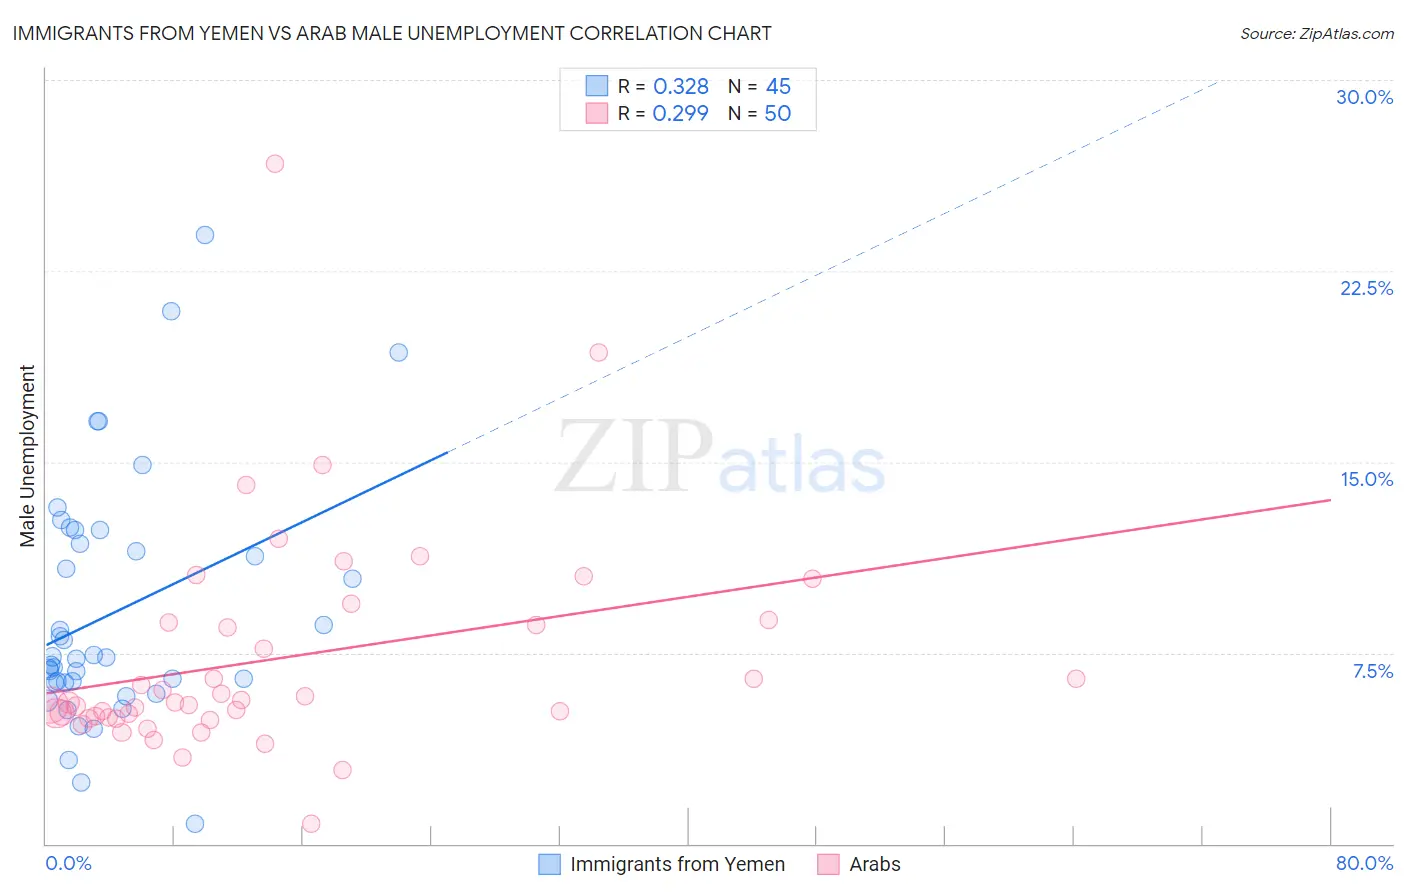
Immigrants from Yemen vs Arab Male Unemployment Correlation Chart
The statistical analysis conducted on geographies consisting of 82,399,512 people shows a mild positive correlation between the proportion of Immigrants from Yemen and unemployment rate among males in the United States with a correlation coefficient (R) of 0.328 and weighted average of 7.8%. Similarly, the statistical analysis conducted on geographies consisting of 483,718,645 people shows a weak positive correlation between the proportion of Arabs and unemployment rate among males in the United States with a correlation coefficient (R) of 0.299 and weighted average of 5.4%, a difference of 45.3%.
Male Unemployment Correlation Summary
| Measurement | Immigrants from Yemen | Arab |
| Minimum | 0.80% | 0.80% |
| Maximum | 23.9% | 26.7% |
| Range | 23.1% | 25.9% |
| Mean | 9.1% | 7.3% |
| Median | 7.3% | 5.5% |
| Interquartile 25% (IQ1) | 6.3% | 4.9% |
| Interquartile 75% (IQ3) | 12.1% | 8.7% |
| Interquartile Range (IQR) | 5.7% | 3.7% |
| Standard Deviation (Sample) | 4.8% | 4.4% |
| Standard Deviation (Population) | 4.8% | 4.3% |
Similar Demographics by Male Unemployment
Demographics Similar to Immigrants from Yemen by Male Unemployment
In terms of male unemployment, the demographic groups most similar to Immigrants from Yemen are Native/Alaskan (7.7%, a difference of 0.90%), Paiute (7.7%, a difference of 1.3%), Yakama (7.9%, a difference of 1.8%), Immigrants from Dominican Republic (7.6%, a difference of 2.4%), and Shoshone (7.6%, a difference of 2.5%).
| Demographics | Rating | Rank | Male Unemployment |
| Immigrants | Cabo Verde | 0.0 /100 | #322 | Tragic 7.5% |
| Immigrants | Grenada | 0.0 /100 | #323 | Tragic 7.6% |
| Dominicans | 0.0 /100 | #324 | Tragic 7.6% |
| Shoshone | 0.0 /100 | #325 | Tragic 7.6% |
| Immigrants | Dominican Republic | 0.0 /100 | #326 | Tragic 7.6% |
| Paiute | 0.0 /100 | #327 | Tragic 7.7% |
| Natives/Alaskans | 0.0 /100 | #328 | Tragic 7.7% |
| Immigrants | Yemen | 0.0 /100 | #329 | Tragic 7.8% |
| Yakama | 0.0 /100 | #330 | Tragic 7.9% |
| Alaska Natives | 0.0 /100 | #331 | Tragic 8.1% |
| Pima | 0.0 /100 | #332 | Tragic 8.3% |
| Sioux | 0.0 /100 | #333 | Tragic 8.4% |
| Tsimshian | 0.0 /100 | #334 | Tragic 8.5% |
| Pueblo | 0.0 /100 | #335 | Tragic 8.5% |
| Yuman | 0.0 /100 | #336 | Tragic 8.6% |
Demographics Similar to Arabs by Male Unemployment
In terms of male unemployment, the demographic groups most similar to Arabs are Immigrants from South America (5.4%, a difference of 0.060%), Costa Rican (5.4%, a difference of 0.080%), Iraqi (5.4%, a difference of 0.090%), Immigrants from Uganda (5.4%, a difference of 0.10%), and Immigrants from South Eastern Asia (5.4%, a difference of 0.14%).
| Demographics | Rating | Rank | Male Unemployment |
| Immigrants | Afghanistan | 37.9 /100 | #181 | Fair 5.3% |
| Potawatomi | 37.8 /100 | #182 | Fair 5.3% |
| Taiwanese | 37.6 /100 | #183 | Fair 5.3% |
| Spaniards | 35.1 /100 | #184 | Fair 5.3% |
| Koreans | 34.9 /100 | #185 | Fair 5.3% |
| Iraqis | 31.6 /100 | #186 | Fair 5.4% |
| Costa Ricans | 31.3 /100 | #187 | Fair 5.4% |
| Arabs | 30.2 /100 | #188 | Fair 5.4% |
| Immigrants | South America | 29.4 /100 | #189 | Fair 5.4% |
| Immigrants | Uganda | 28.8 /100 | #190 | Fair 5.4% |
| Immigrants | South Eastern Asia | 28.2 /100 | #191 | Fair 5.4% |
| Immigrants | Belarus | 26.0 /100 | #192 | Fair 5.4% |
| Immigrants | Israel | 25.2 /100 | #193 | Fair 5.4% |
| Spanish | 19.7 /100 | #194 | Poor 5.4% |
| Immigrants | Southern Europe | 17.7 /100 | #195 | Poor 5.4% |