Immigrants from West Indies vs South African Unemployment Among Ages 16 to 19 years
COMPARE
Immigrants from West Indies
South African
Unemployment Among Ages 16 to 19 years
Unemployment Among Ages 16 to 19 years Comparison
Immigrants from West Indies
South Africans
22.2%
UNEMPLOYMENT AMONG AGES 16 TO 19 YEARS
0.0/ 100
METRIC RATING
319th/ 347
METRIC RANK
16.9%
UNEMPLOYMENT AMONG AGES 16 TO 19 YEARS
95.9/ 100
METRIC RATING
92nd/ 347
METRIC RANK
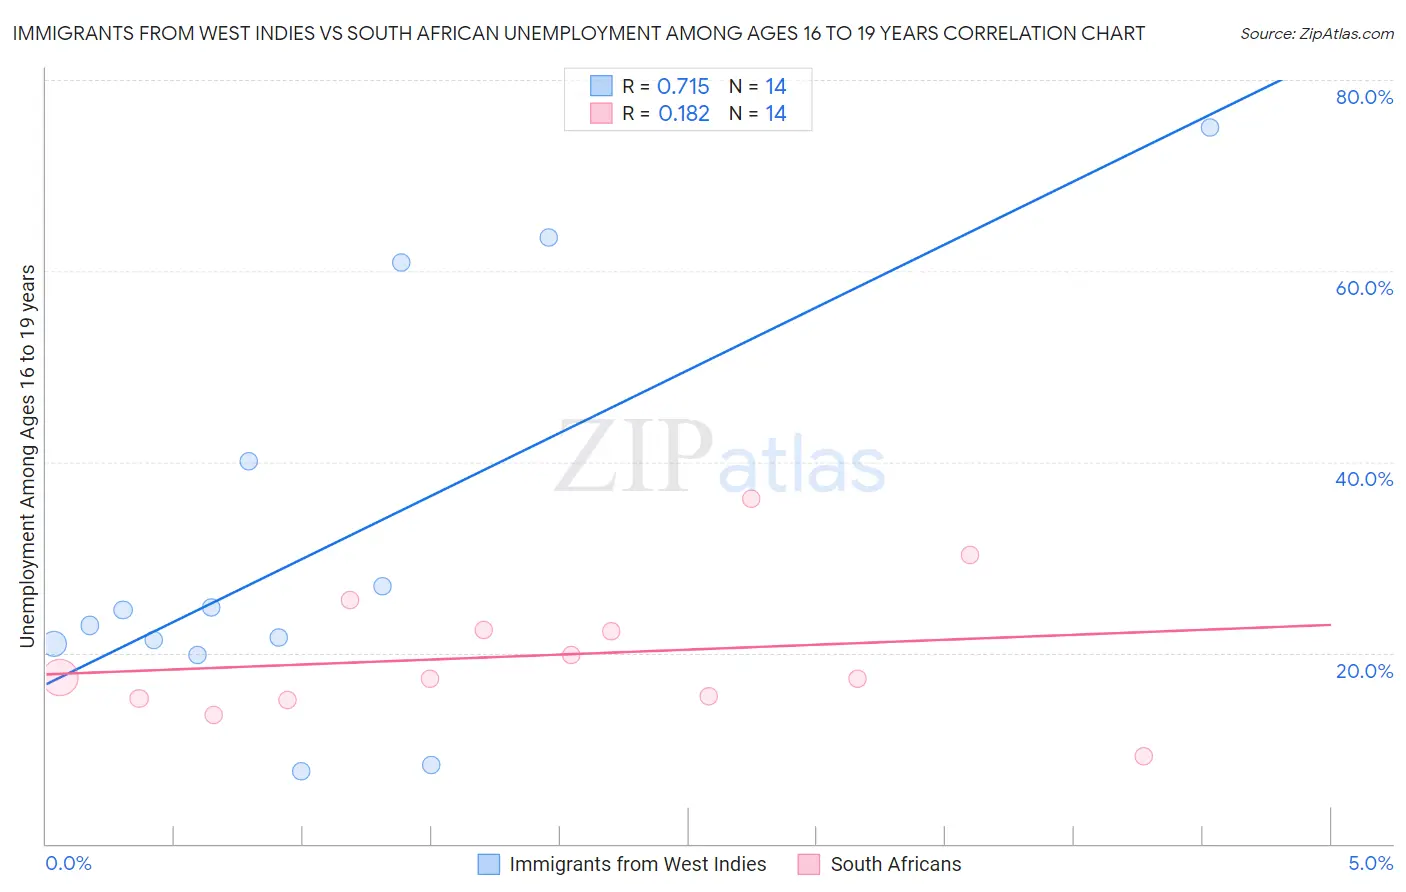
Immigrants from West Indies vs South African Unemployment Among Ages 16 to 19 years Correlation Chart
The statistical analysis conducted on geographies consisting of 71,880,960 people shows a strong positive correlation between the proportion of Immigrants from West Indies and unemployment rate among population between the ages 16 and 19 in the United States with a correlation coefficient (R) of 0.715 and weighted average of 22.2%. Similarly, the statistical analysis conducted on geographies consisting of 176,310,697 people shows a poor positive correlation between the proportion of South Africans and unemployment rate among population between the ages 16 and 19 in the United States with a correlation coefficient (R) of 0.182 and weighted average of 16.9%, a difference of 31.4%.
Unemployment Among Ages 16 to 19 years Correlation Summary
| Measurement | Immigrants from West Indies | South African |
| Minimum | 7.6% | 9.1% |
| Maximum | 75.0% | 36.2% |
| Range | 67.4% | 27.1% |
| Mean | 31.3% | 19.7% |
| Median | 23.7% | 17.3% |
| Interquartile 25% (IQ1) | 21.0% | 15.2% |
| Interquartile 75% (IQ3) | 40.1% | 22.4% |
| Interquartile Range (IQR) | 19.2% | 7.3% |
| Standard Deviation (Sample) | 20.8% | 7.1% |
| Standard Deviation (Population) | 20.0% | 6.9% |
Similar Demographics by Unemployment Among Ages 16 to 19 years
Demographics Similar to Immigrants from West Indies by Unemployment Among Ages 16 to 19 years
In terms of unemployment among ages 16 to 19 years, the demographic groups most similar to Immigrants from West Indies are Immigrants from Jamaica (22.2%, a difference of 0.16%), Cheyenne (22.3%, a difference of 0.23%), Immigrants from Belize (22.2%, a difference of 0.31%), Tohono O'odham (22.1%, a difference of 0.76%), and West Indian (22.4%, a difference of 0.92%).
| Demographics | Rating | Rank | Unemployment Among Ages 16 to 19 years |
| Houma | 0.0 /100 | #312 | Tragic 21.6% |
| Jamaicans | 0.0 /100 | #313 | Tragic 21.7% |
| Alaska Natives | 0.0 /100 | #314 | Tragic 21.8% |
| Immigrants | Dominica | 0.0 /100 | #315 | Tragic 21.9% |
| Tohono O'odham | 0.0 /100 | #316 | Tragic 22.1% |
| Immigrants | Belize | 0.0 /100 | #317 | Tragic 22.2% |
| Immigrants | Jamaica | 0.0 /100 | #318 | Tragic 22.2% |
| Immigrants | West Indies | 0.0 /100 | #319 | Tragic 22.2% |
| Cheyenne | 0.0 /100 | #320 | Tragic 22.3% |
| West Indians | 0.0 /100 | #321 | Tragic 22.4% |
| Barbadians | 0.0 /100 | #322 | Tragic 22.5% |
| Yakama | 0.0 /100 | #323 | Tragic 22.5% |
| Immigrants | Armenia | 0.0 /100 | #324 | Tragic 22.6% |
| Trinidadians and Tobagonians | 0.0 /100 | #325 | Tragic 22.6% |
| Immigrants | Trinidad and Tobago | 0.0 /100 | #326 | Tragic 23.1% |
Demographics Similar to South Africans by Unemployment Among Ages 16 to 19 years
In terms of unemployment among ages 16 to 19 years, the demographic groups most similar to South Africans are Cuban (16.9%, a difference of 0.040%), Bangladeshi (16.9%, a difference of 0.050%), Mongolian (16.9%, a difference of 0.12%), Cambodian (16.9%, a difference of 0.13%), and Ottawa (16.9%, a difference of 0.16%).
| Demographics | Rating | Rank | Unemployment Among Ages 16 to 19 years |
| Immigrants | Kuwait | 97.2 /100 | #85 | Exceptional 16.8% |
| Immigrants | Scotland | 97.2 /100 | #86 | Exceptional 16.8% |
| Greeks | 97.0 /100 | #87 | Exceptional 16.9% |
| Immigrants | South Africa | 96.9 /100 | #88 | Exceptional 16.9% |
| Canadians | 96.7 /100 | #89 | Exceptional 16.9% |
| Asians | 96.6 /100 | #90 | Exceptional 16.9% |
| Cambodians | 96.3 /100 | #91 | Exceptional 16.9% |
| South Africans | 95.9 /100 | #92 | Exceptional 16.9% |
| Cubans | 95.8 /100 | #93 | Exceptional 16.9% |
| Bangladeshis | 95.8 /100 | #94 | Exceptional 16.9% |
| Mongolians | 95.6 /100 | #95 | Exceptional 16.9% |
| Ottawa | 95.4 /100 | #96 | Exceptional 16.9% |
| Immigrants | Venezuela | 95.3 /100 | #97 | Exceptional 16.9% |
| Burmese | 95.0 /100 | #98 | Exceptional 17.0% |
| Immigrants | Lithuania | 94.9 /100 | #99 | Exceptional 17.0% |