Czech vs South African Unemployment Among Ages 16 to 19 years
COMPARE
Czech
South African
Unemployment Among Ages 16 to 19 years
Unemployment Among Ages 16 to 19 years Comparison
Czechs
South Africans
15.4%
UNEMPLOYMENT AMONG AGES 16 TO 19 YEARS
100.0/ 100
METRIC RATING
8th/ 347
METRIC RANK
16.9%
UNEMPLOYMENT AMONG AGES 16 TO 19 YEARS
95.9/ 100
METRIC RATING
92nd/ 347
METRIC RANK
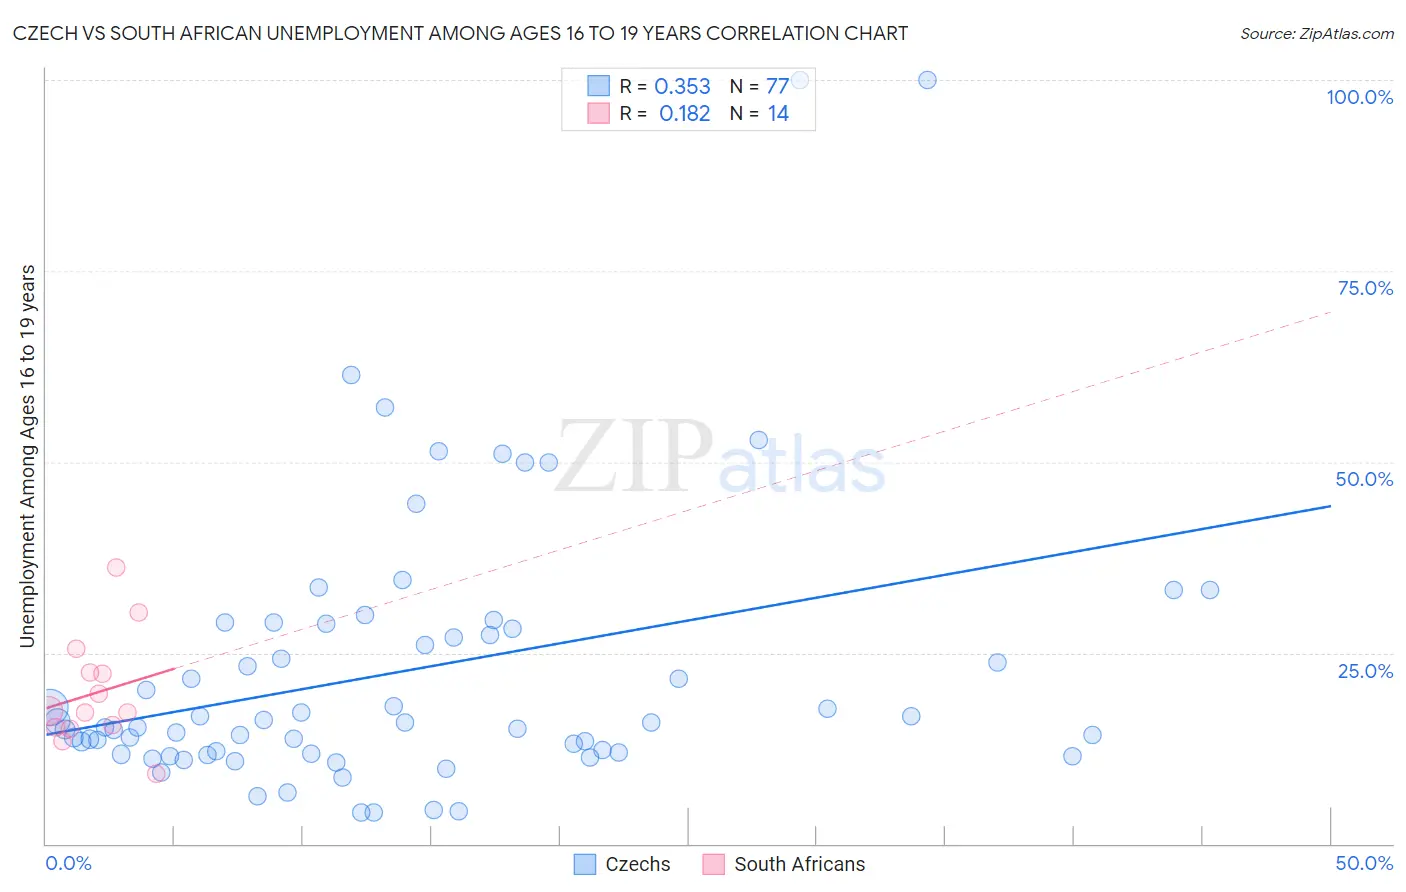
Czech vs South African Unemployment Among Ages 16 to 19 years Correlation Chart
The statistical analysis conducted on geographies consisting of 445,681,187 people shows a mild positive correlation between the proportion of Czechs and unemployment rate among population between the ages 16 and 19 in the United States with a correlation coefficient (R) of 0.353 and weighted average of 15.4%. Similarly, the statistical analysis conducted on geographies consisting of 176,310,697 people shows a poor positive correlation between the proportion of South Africans and unemployment rate among population between the ages 16 and 19 in the United States with a correlation coefficient (R) of 0.182 and weighted average of 16.9%, a difference of 10.0%.
Unemployment Among Ages 16 to 19 years Correlation Summary
| Measurement | Czech | South African |
| Minimum | 4.0% | 9.1% |
| Maximum | 100.0% | 36.2% |
| Range | 96.0% | 27.1% |
| Mean | 22.7% | 19.7% |
| Median | 15.9% | 17.3% |
| Interquartile 25% (IQ1) | 11.8% | 15.2% |
| Interquartile 75% (IQ3) | 28.5% | 22.4% |
| Interquartile Range (IQR) | 16.7% | 7.3% |
| Standard Deviation (Sample) | 18.3% | 7.1% |
| Standard Deviation (Population) | 18.2% | 6.9% |
Similar Demographics by Unemployment Among Ages 16 to 19 years
Demographics Similar to Czechs by Unemployment Among Ages 16 to 19 years
In terms of unemployment among ages 16 to 19 years, the demographic groups most similar to Czechs are Immigrants from Bosnia and Herzegovina (15.3%, a difference of 0.24%), Scandinavian (15.4%, a difference of 0.33%), Swedish (15.3%, a difference of 0.41%), Zimbabwean (15.4%, a difference of 0.44%), and Immigrants from Somalia (15.3%, a difference of 0.68%).
| Demographics | Rating | Rank | Unemployment Among Ages 16 to 19 years |
| Norwegians | 100.0 /100 | #1 | Exceptional 14.5% |
| Immigrants | India | 100.0 /100 | #2 | Exceptional 15.0% |
| Luxembourgers | 100.0 /100 | #3 | Exceptional 15.1% |
| Danes | 100.0 /100 | #4 | Exceptional 15.2% |
| Immigrants | Somalia | 100.0 /100 | #5 | Exceptional 15.3% |
| Swedes | 100.0 /100 | #6 | Exceptional 15.3% |
| Immigrants | Bosnia and Herzegovina | 100.0 /100 | #7 | Exceptional 15.3% |
| Czechs | 100.0 /100 | #8 | Exceptional 15.4% |
| Scandinavians | 100.0 /100 | #9 | Exceptional 15.4% |
| Zimbabweans | 100.0 /100 | #10 | Exceptional 15.4% |
| Indonesians | 100.0 /100 | #11 | Exceptional 15.5% |
| Taiwanese | 100.0 /100 | #12 | Exceptional 15.5% |
| Immigrants | Burma/Myanmar | 100.0 /100 | #13 | Exceptional 15.6% |
| Immigrants | Zaire | 100.0 /100 | #14 | Exceptional 15.6% |
| Yugoslavians | 100.0 /100 | #15 | Exceptional 15.6% |
Demographics Similar to South Africans by Unemployment Among Ages 16 to 19 years
In terms of unemployment among ages 16 to 19 years, the demographic groups most similar to South Africans are Cuban (16.9%, a difference of 0.040%), Bangladeshi (16.9%, a difference of 0.050%), Mongolian (16.9%, a difference of 0.12%), Cambodian (16.9%, a difference of 0.13%), and Ottawa (16.9%, a difference of 0.16%).
| Demographics | Rating | Rank | Unemployment Among Ages 16 to 19 years |
| Immigrants | Kuwait | 97.2 /100 | #85 | Exceptional 16.8% |
| Immigrants | Scotland | 97.2 /100 | #86 | Exceptional 16.8% |
| Greeks | 97.0 /100 | #87 | Exceptional 16.9% |
| Immigrants | South Africa | 96.9 /100 | #88 | Exceptional 16.9% |
| Canadians | 96.7 /100 | #89 | Exceptional 16.9% |
| Asians | 96.6 /100 | #90 | Exceptional 16.9% |
| Cambodians | 96.3 /100 | #91 | Exceptional 16.9% |
| South Africans | 95.9 /100 | #92 | Exceptional 16.9% |
| Cubans | 95.8 /100 | #93 | Exceptional 16.9% |
| Bangladeshis | 95.8 /100 | #94 | Exceptional 16.9% |
| Mongolians | 95.6 /100 | #95 | Exceptional 16.9% |
| Ottawa | 95.4 /100 | #96 | Exceptional 16.9% |
| Immigrants | Venezuela | 95.3 /100 | #97 | Exceptional 16.9% |
| Burmese | 95.0 /100 | #98 | Exceptional 17.0% |
| Immigrants | Lithuania | 94.9 /100 | #99 | Exceptional 17.0% |