Immigrants from Vietnam vs Colville Unemployment Among Ages 25 to 29 years
COMPARE
Immigrants from Vietnam
Colville
Unemployment Among Ages 25 to 29 years
Unemployment Among Ages 25 to 29 years Comparison
Immigrants from Vietnam
Colville
6.5%
UNEMPLOYMENT AMONG AGES 25 TO 29 YEARS
75.6/ 100
METRIC RATING
134th/ 347
METRIC RANK
9.2%
UNEMPLOYMENT AMONG AGES 25 TO 29 YEARS
0.0/ 100
METRIC RATING
327th/ 347
METRIC RANK
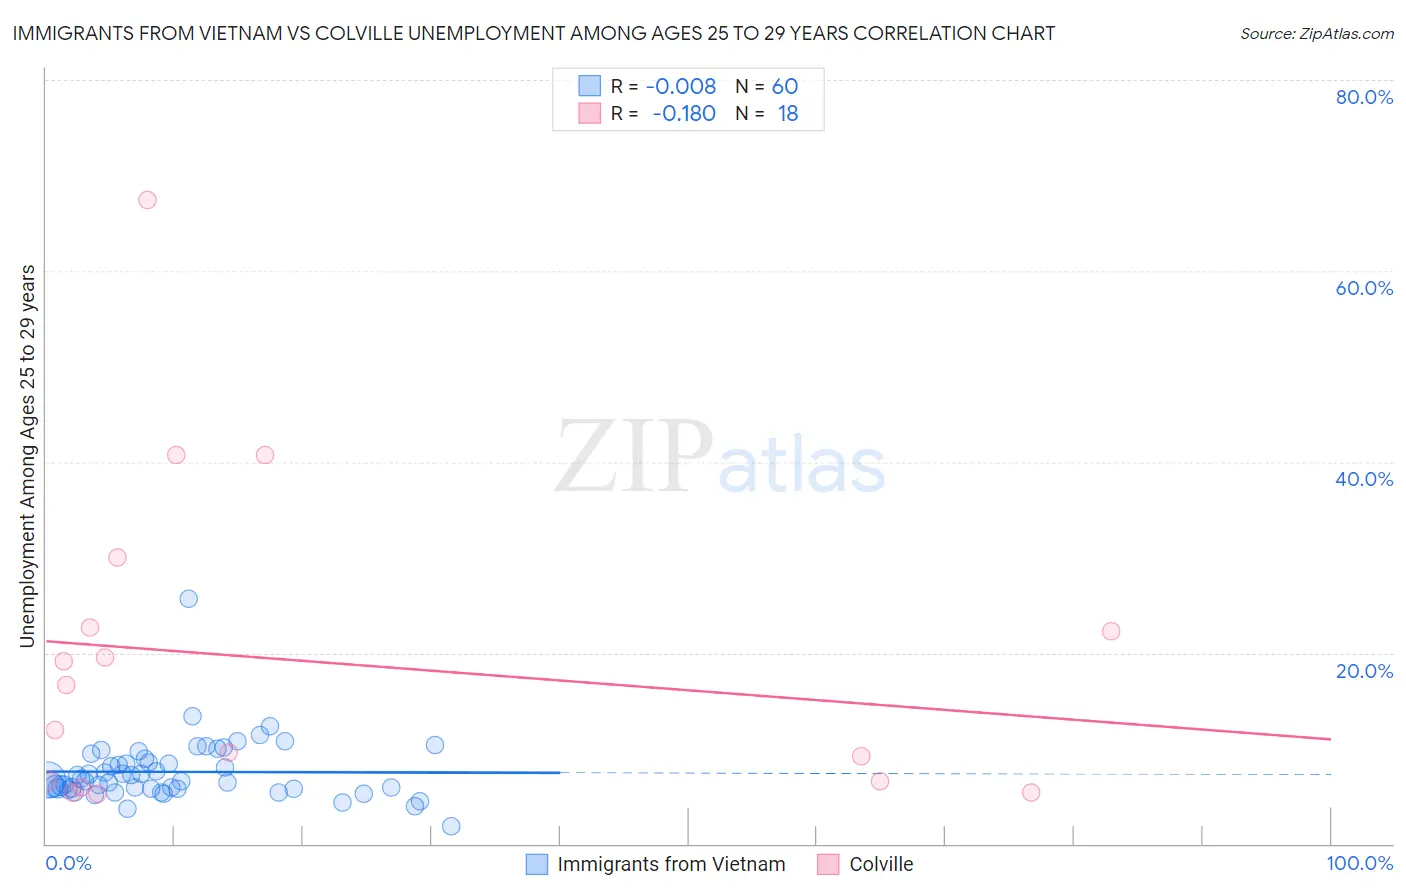
Immigrants from Vietnam vs Colville Unemployment Among Ages 25 to 29 years Correlation Chart
The statistical analysis conducted on geographies consisting of 387,105,673 people shows no correlation between the proportion of Immigrants from Vietnam and unemployment rate among population between the ages 25 and 29 in the United States with a correlation coefficient (R) of -0.008 and weighted average of 6.5%. Similarly, the statistical analysis conducted on geographies consisting of 34,069,511 people shows a poor negative correlation between the proportion of Colville and unemployment rate among population between the ages 25 and 29 in the United States with a correlation coefficient (R) of -0.180 and weighted average of 9.2%, a difference of 41.5%.
Unemployment Among Ages 25 to 29 years Correlation Summary
| Measurement | Immigrants from Vietnam | Colville |
| Minimum | 1.8% | 5.3% |
| Maximum | 25.7% | 67.4% |
| Range | 23.9% | 62.1% |
| Mean | 7.5% | 19.1% |
| Median | 6.6% | 14.3% |
| Interquartile 25% (IQ1) | 5.7% | 6.5% |
| Interquartile 75% (IQ3) | 8.7% | 22.7% |
| Interquartile Range (IQR) | 2.9% | 16.2% |
| Standard Deviation (Sample) | 3.3% | 16.6% |
| Standard Deviation (Population) | 3.2% | 16.2% |
Similar Demographics by Unemployment Among Ages 25 to 29 years
Demographics Similar to Immigrants from Vietnam by Unemployment Among Ages 25 to 29 years
In terms of unemployment among ages 25 to 29 years, the demographic groups most similar to Immigrants from Vietnam are Immigrants from Europe (6.5%, a difference of 0.010%), Immigrants from Croatia (6.5%, a difference of 0.010%), Northern European (6.5%, a difference of 0.020%), Polish (6.5%, a difference of 0.090%), and Eastern European (6.5%, a difference of 0.13%).
| Demographics | Rating | Rank | Unemployment Among Ages 25 to 29 years |
| Dutch | 80.6 /100 | #127 | Excellent 6.5% |
| Immigrants | Chile | 80.5 /100 | #128 | Excellent 6.5% |
| Sri Lankans | 80.3 /100 | #129 | Excellent 6.5% |
| Immigrants | Peru | 79.9 /100 | #130 | Good 6.5% |
| Immigrants | Afghanistan | 79.2 /100 | #131 | Good 6.5% |
| Poles | 76.6 /100 | #132 | Good 6.5% |
| Immigrants | Europe | 75.7 /100 | #133 | Good 6.5% |
| Immigrants | Vietnam | 75.6 /100 | #134 | Good 6.5% |
| Immigrants | Croatia | 75.5 /100 | #135 | Good 6.5% |
| Northern Europeans | 75.4 /100 | #136 | Good 6.5% |
| Eastern Europeans | 74.1 /100 | #137 | Good 6.5% |
| Immigrants | Belgium | 73.8 /100 | #138 | Good 6.5% |
| Austrians | 73.8 /100 | #139 | Good 6.5% |
| Immigrants | Pakistan | 73.8 /100 | #140 | Good 6.5% |
| Maltese | 72.9 /100 | #141 | Good 6.5% |
Demographics Similar to Colville by Unemployment Among Ages 25 to 29 years
In terms of unemployment among ages 25 to 29 years, the demographic groups most similar to Colville are Shoshone (9.2%, a difference of 0.16%), Apache (9.5%, a difference of 2.6%), Aleut (9.7%, a difference of 4.9%), Yakama (8.8%, a difference of 5.5%), and Houma (8.7%, a difference of 6.0%).
| Demographics | Rating | Rank | Unemployment Among Ages 25 to 29 years |
| Blacks/African Americans | 0.0 /100 | #320 | Tragic 8.6% |
| Immigrants | Dominican Republic | 0.0 /100 | #321 | Tragic 8.6% |
| Tlingit-Haida | 0.0 /100 | #322 | Tragic 8.7% |
| Dominicans | 0.0 /100 | #323 | Tragic 8.7% |
| Houma | 0.0 /100 | #324 | Tragic 8.7% |
| Yakama | 0.0 /100 | #325 | Tragic 8.8% |
| Shoshone | 0.0 /100 | #326 | Tragic 9.2% |
| Colville | 0.0 /100 | #327 | Tragic 9.2% |
| Apache | 0.0 /100 | #328 | Tragic 9.5% |
| Aleuts | 0.0 /100 | #329 | Tragic 9.7% |
| Natives/Alaskans | 0.0 /100 | #330 | Tragic 9.8% |
| Alaska Natives | 0.0 /100 | #331 | Tragic 10.2% |
| Pueblo | 0.0 /100 | #332 | Tragic 10.4% |
| Alaskan Athabascans | 0.0 /100 | #333 | Tragic 10.8% |
| Yuman | 0.0 /100 | #334 | Tragic 11.0% |