Hopi vs Colville Unemployment Among Ages 25 to 29 years
COMPARE
Hopi
Colville
Unemployment Among Ages 25 to 29 years
Unemployment Among Ages 25 to 29 years Comparison
Hopi
Colville
13.5%
UNEMPLOYMENT AMONG AGES 25 TO 29 YEARS
0.0/ 100
METRIC RATING
344th/ 347
METRIC RANK
9.2%
UNEMPLOYMENT AMONG AGES 25 TO 29 YEARS
0.0/ 100
METRIC RATING
327th/ 347
METRIC RANK
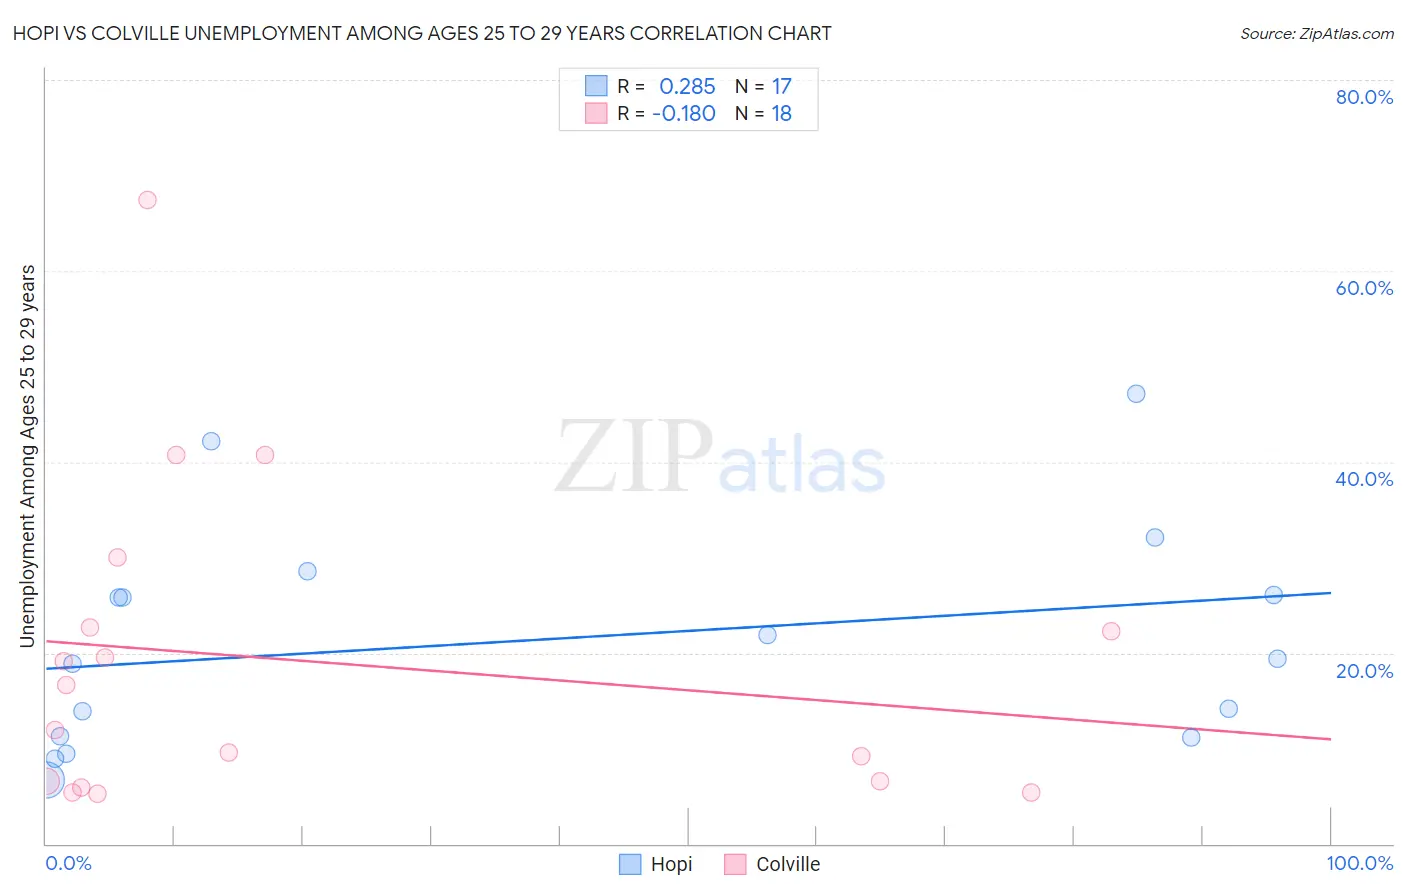
Hopi vs Colville Unemployment Among Ages 25 to 29 years Correlation Chart
The statistical analysis conducted on geographies consisting of 74,011,097 people shows a weak positive correlation between the proportion of Hopi and unemployment rate among population between the ages 25 and 29 in the United States with a correlation coefficient (R) of 0.285 and weighted average of 13.5%. Similarly, the statistical analysis conducted on geographies consisting of 34,069,511 people shows a poor negative correlation between the proportion of Colville and unemployment rate among population between the ages 25 and 29 in the United States with a correlation coefficient (R) of -0.180 and weighted average of 9.2%, a difference of 46.2%.
Unemployment Among Ages 25 to 29 years Correlation Summary
| Measurement | Hopi | Colville |
| Minimum | 6.6% | 5.3% |
| Maximum | 47.2% | 67.4% |
| Range | 40.6% | 62.1% |
| Mean | 21.4% | 19.1% |
| Median | 19.4% | 14.3% |
| Interquartile 25% (IQ1) | 11.2% | 6.5% |
| Interquartile 75% (IQ3) | 27.3% | 22.7% |
| Interquartile Range (IQR) | 16.2% | 16.2% |
| Standard Deviation (Sample) | 11.6% | 16.6% |
| Standard Deviation (Population) | 11.3% | 16.2% |
Demographics Similar to Hopi and Colville by Unemployment Among Ages 25 to 29 years
In terms of unemployment among ages 25 to 29 years, the demographic groups most similar to Hopi are Inupiat (13.4%, a difference of 0.65%), Navajo (12.2%, a difference of 11.0%), Tohono O'odham (12.1%, a difference of 11.9%), Arapaho (15.4%, a difference of 13.7%), and Cheyenne (11.8%, a difference of 14.3%). Similarly, the demographic groups most similar to Colville are Shoshone (9.2%, a difference of 0.16%), Apache (9.5%, a difference of 2.6%), Aleut (9.7%, a difference of 4.9%), Yakama (8.8%, a difference of 5.5%), and Native/Alaskan (9.8%, a difference of 6.3%).
| Demographics | Rating | Rank | Unemployment Among Ages 25 to 29 years |
| Yakama | 0.0 /100 | #325 | Tragic 8.8% |
| Shoshone | 0.0 /100 | #326 | Tragic 9.2% |
| Colville | 0.0 /100 | #327 | Tragic 9.2% |
| Apache | 0.0 /100 | #328 | Tragic 9.5% |
| Aleuts | 0.0 /100 | #329 | Tragic 9.7% |
| Natives/Alaskans | 0.0 /100 | #330 | Tragic 9.8% |
| Alaska Natives | 0.0 /100 | #331 | Tragic 10.2% |
| Pueblo | 0.0 /100 | #332 | Tragic 10.4% |
| Alaskan Athabascans | 0.0 /100 | #333 | Tragic 10.8% |
| Yuman | 0.0 /100 | #334 | Tragic 11.0% |
| Puerto Ricans | 0.0 /100 | #335 | Tragic 11.1% |
| Lumbee | 0.0 /100 | #336 | Tragic 11.2% |
| Menominee | 0.0 /100 | #337 | Tragic 11.3% |
| Sioux | 0.0 /100 | #338 | Tragic 11.7% |
| Pima | 0.0 /100 | #339 | Tragic 11.8% |
| Cheyenne | 0.0 /100 | #340 | Tragic 11.8% |
| Tohono O'odham | 0.0 /100 | #341 | Tragic 12.1% |
| Navajo | 0.0 /100 | #342 | Tragic 12.2% |
| Inupiat | 0.0 /100 | #343 | Tragic 13.4% |
| Hopi | 0.0 /100 | #344 | Tragic 13.5% |
| Arapaho | 0.0 /100 | #345 | Tragic 15.4% |