Immigrants from Venezuela vs Immigrants from Bahamas Unemployment Among Women with Children Under 6 years
COMPARE
Immigrants from Venezuela
Immigrants from Bahamas
Unemployment Among Women with Children Under 6 years
Unemployment Among Women with Children Under 6 years Comparison
Immigrants from Venezuela
Immigrants from Bahamas
7.1%
UNEMPLOYMENT AMONG WOMEN WITH CHILDREN UNDER 6 YEARS
98.8/ 100
METRIC RATING
81st/ 347
METRIC RANK
9.6%
UNEMPLOYMENT AMONG WOMEN WITH CHILDREN UNDER 6 YEARS
0.0/ 100
METRIC RATING
323rd/ 347
METRIC RANK
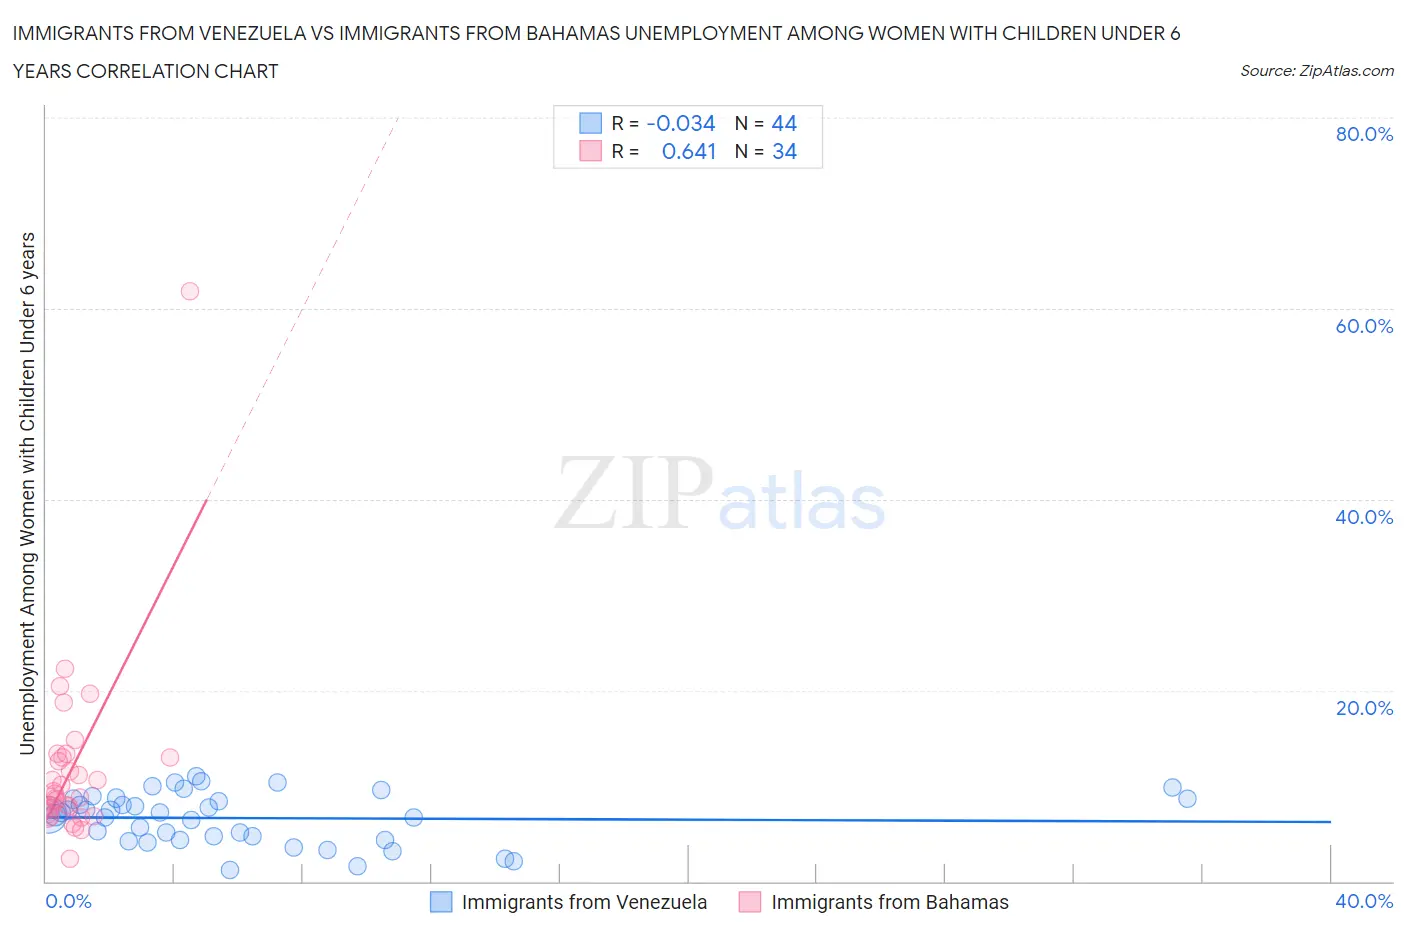
Immigrants from Venezuela vs Immigrants from Bahamas Unemployment Among Women with Children Under 6 years Correlation Chart
The statistical analysis conducted on geographies consisting of 233,969,116 people shows no correlation between the proportion of Immigrants from Venezuela and unemployment rate among women with children under the age of 6 in the United States with a correlation coefficient (R) of -0.034 and weighted average of 7.1%. Similarly, the statistical analysis conducted on geographies consisting of 94,063,271 people shows a significant positive correlation between the proportion of Immigrants from Bahamas and unemployment rate among women with children under the age of 6 in the United States with a correlation coefficient (R) of 0.641 and weighted average of 9.6%, a difference of 36.0%.
Unemployment Among Women with Children Under 6 years Correlation Summary
| Measurement | Immigrants from Venezuela | Immigrants from Bahamas |
| Minimum | 1.2% | 2.3% |
| Maximum | 11.0% | 61.8% |
| Range | 9.8% | 59.5% |
| Mean | 6.6% | 11.9% |
| Median | 7.1% | 9.3% |
| Interquartile 25% (IQ1) | 4.5% | 7.1% |
| Interquartile 75% (IQ3) | 8.6% | 12.9% |
| Interquartile Range (IQR) | 4.1% | 5.8% |
| Standard Deviation (Sample) | 2.6% | 9.9% |
| Standard Deviation (Population) | 2.6% | 9.8% |
Similar Demographics by Unemployment Among Women with Children Under 6 years
Demographics Similar to Immigrants from Venezuela by Unemployment Among Women with Children Under 6 years
In terms of unemployment among women with children under 6 years, the demographic groups most similar to Immigrants from Venezuela are Immigrants from Greece (7.1%, a difference of 0.040%), Immigrants from Fiji (7.1%, a difference of 0.060%), Immigrants from Somalia (7.1%, a difference of 0.11%), Immigrants from Croatia (7.1%, a difference of 0.15%), and Immigrants from Afghanistan (7.1%, a difference of 0.15%).
| Demographics | Rating | Rank | Unemployment Among Women with Children Under 6 years |
| Turks | 99.2 /100 | #74 | Exceptional 7.0% |
| Immigrants | Eastern Europe | 99.0 /100 | #75 | Exceptional 7.1% |
| Estonians | 99.0 /100 | #76 | Exceptional 7.1% |
| Immigrants | Croatia | 98.9 /100 | #77 | Exceptional 7.1% |
| Immigrants | Somalia | 98.9 /100 | #78 | Exceptional 7.1% |
| Immigrants | Fiji | 98.9 /100 | #79 | Exceptional 7.1% |
| Immigrants | Greece | 98.9 /100 | #80 | Exceptional 7.1% |
| Immigrants | Venezuela | 98.8 /100 | #81 | Exceptional 7.1% |
| Immigrants | Afghanistan | 98.7 /100 | #82 | Exceptional 7.1% |
| Egyptians | 98.7 /100 | #83 | Exceptional 7.1% |
| Immigrants | Albania | 98.7 /100 | #84 | Exceptional 7.1% |
| Immigrants | Romania | 98.7 /100 | #85 | Exceptional 7.1% |
| Immigrants | Zimbabwe | 98.6 /100 | #86 | Exceptional 7.1% |
| Alsatians | 98.4 /100 | #87 | Exceptional 7.1% |
| Immigrants | Hungary | 98.3 /100 | #88 | Exceptional 7.1% |
Demographics Similar to Immigrants from Bahamas by Unemployment Among Women with Children Under 6 years
In terms of unemployment among women with children under 6 years, the demographic groups most similar to Immigrants from Bahamas are Alaska Native (9.6%, a difference of 0.19%), Central American Indian (9.6%, a difference of 0.44%), Potawatomi (9.6%, a difference of 0.50%), Marshallese (9.6%, a difference of 0.55%), and Paiute (9.7%, a difference of 0.70%).
| Demographics | Rating | Rank | Unemployment Among Women with Children Under 6 years |
| Houma | 0.0 /100 | #316 | Tragic 9.4% |
| Dutch West Indians | 0.0 /100 | #317 | Tragic 9.5% |
| Osage | 0.0 /100 | #318 | Tragic 9.5% |
| Marshallese | 0.0 /100 | #319 | Tragic 9.6% |
| Potawatomi | 0.0 /100 | #320 | Tragic 9.6% |
| Central American Indians | 0.0 /100 | #321 | Tragic 9.6% |
| Alaska Natives | 0.0 /100 | #322 | Tragic 9.6% |
| Immigrants | Bahamas | 0.0 /100 | #323 | Tragic 9.6% |
| Paiute | 0.0 /100 | #324 | Tragic 9.7% |
| Choctaw | 0.0 /100 | #325 | Tragic 9.8% |
| Delaware | 0.0 /100 | #326 | Tragic 9.8% |
| Ottawa | 0.0 /100 | #327 | Tragic 9.9% |
| Tohono O'odham | 0.0 /100 | #328 | Tragic 10.2% |
| Blacks/African Americans | 0.0 /100 | #329 | Tragic 10.3% |
| Pennsylvania Germans | 0.0 /100 | #330 | Tragic 10.8% |