Immigrants from Venezuela vs Immigrants from Bahamas In Labor Force | Age 16-19

COMPARE

Immigrants from Venezuela
Race
Ancestry
AfghanAfricanAlaska NativeAlaskan AthabascanAlbanianAleutAlsatianAmericanApacheArabArapahoArgentineanArmenianAssyrian/Chaldean/SyriacAustralianAustrianBahamianBangladeshiBarbadianBasqueBelgianBelizeanBermudanBhutaneseBlackfeetBolivianBrazilianBritishBritish West IndianBulgarianBurmeseCajunCambodianCanadianCape VerdeanCarpatho RusynCelticCentral AmericanCentral American IndianCherokeeCheyenneChickasawChileanChineseChippewaChoctawColombianColvilleComancheCosta RicanCreeCreekCroatianCrowCubanCypriotCzechCzechoslovakianDanishDelawareDominicanDutchDutch West IndianEastern EuropeanEcuadorianEgyptianEnglishEstonianEthiopianEuropeanFijianFilipinoFinnishFrenchFrench American IndianFrench CanadianGermanGerman RussianGhanaianGreekGuamanian/ChamorroGuatemalanGuyaneseHaitianHmongHonduranHopiHoumaHungarianIcelanderIndian (Asian)IndonesianInupiatIranianIraqiIrishIroquoisIsraeliItalianJamaicanJapaneseJordanianKenyanKiowaKoreanLaotianLatvianLebaneseLiberianLithuanianLumbeeLuxembourgerMacedonianMalaysianMalteseMarshalleseMenomineeMexicanMexican American IndianMongolianMoroccanNative HawaiianNavajoNepaleseNew ZealanderNicaraguanNigerianNorthern EuropeanNorwegianOkinawanOsageOttawaPaiutePakistaniPalestinianPanamanianParaguayanPennsylvania GermanPeruvianPimaPolishPortuguesePotawatomiPuebloPuerto RicanPuget Sound SalishRomanianRussianSalvadoranSamoanScandinavianScotch-IrishScottishSeminoleSenegaleseSerbianShoshoneSierra LeoneanSiouxSlavicSlovakSloveneSomaliSouth AfricanSouth AmericanSouth American IndianSoviet UnionSpaniardSpanishSpanish AmericanSpanish American IndianSri LankanSubsaharan AfricanSudaneseSwedishSwissSyrianTaiwaneseThaiTlingit-HaidaTohono O'OdhamTonganTrinidadian and TobagonianTsimshianTurkishU.S. Virgin IslanderUgandanUkrainianUruguayanUteVenezuelanVietnameseWelshWest IndianYakamaYaquiYugoslavianYumanYup'ikZimbabwean
Immigration
NonimmigrantsImmigrantsAfghanistanAfricaAlbaniaArgentinaArmeniaAsiaAustraliaAustriaBangladeshBarbadosBelarusBelgiumBelizeBoliviaBosnia and HerzegovinaBrazilBulgariaBurma/MyanmarCabo VerdeCambodiaCameroonCanadaCaribbeanCentral AmericaChileChinaColombiaCongoCosta RicaCroatiaCubaCzechoslovakiaDenmarkDominicaDominican RepublicEastern AfricaEastern AsiaEastern EuropeEcuadorEgyptEl SalvadorEnglandEritreaEthiopiaEuropeFijiFranceGermanyGhanaGreeceGrenadaGuatemalaGuyanaHaitiHondurasHong KongHungaryIndiaIndonesiaIranIraqIrelandIsraelItalyJamaicaJapanJordanKazakhstanKenyaKoreaKuwaitLaosLatin AmericaLatviaLebanonLiberiaLithuaniaMalaysiaMexicoMicronesiaMiddle AfricaMoldovaMoroccoNepalNetherlandsNicaraguaNigeriaNorth AmericaNorth MacedoniaNorthern AfricaNorthern EuropeNorwayOceaniaPakistanPanamaPeruPhilippinesPolandPortugalRomaniaRussiaSaudi ArabiaScotlandSenegalSerbiaSierra LeoneSingaporeSomaliaSouth AfricaSouth AmericaSouth Central AsiaSouth Eastern AsiaSouthern EuropeSpainSri LankaSt. Vincent and the GrenadinesSudanSwedenSwitzerlandSyriaTaiwanThailandTrinidad and TobagoTurkeyUgandaUkraineUruguayUzbekistanVenezuelaVietnamWest IndiesWestern AfricaWestern AsiaWestern EuropeYemenZaireZimbabweAzores
Immigrants from Bahamas
Race
Ancestry
AfghanAfricanAlaska NativeAlaskan AthabascanAlbanianAleutAlsatianAmericanApacheArabArapahoArgentineanArmenianAssyrian/Chaldean/SyriacAustralianAustrianBahamianBangladeshiBarbadianBasqueBelgianBelizeanBermudanBhutaneseBlackfeetBolivianBrazilianBritishBritish West IndianBulgarianBurmeseCajunCambodianCanadianCape VerdeanCarpatho RusynCelticCentral AmericanCentral American IndianCherokeeCheyenneChickasawChileanChineseChippewaChoctawColombianColvilleComancheCosta RicanCreeCreekCroatianCrowCubanCypriotCzechCzechoslovakianDanishDelawareDominicanDutchDutch West IndianEastern EuropeanEcuadorianEgyptianEnglishEstonianEthiopianEuropeanFijianFilipinoFinnishFrenchFrench American IndianFrench CanadianGermanGerman RussianGhanaianGreekGuamanian/ChamorroGuatemalanGuyaneseHaitianHmongHonduranHopiHoumaHungarianIcelanderIndian (Asian)IndonesianInupiatIranianIraqiIrishIroquoisIsraeliItalianJamaicanJapaneseJordanianKenyanKiowaKoreanLaotianLatvianLebaneseLiberianLithuanianLumbeeLuxembourgerMacedonianMalaysianMalteseMarshalleseMenomineeMexicanMexican American IndianMongolianMoroccanNative HawaiianNavajoNepaleseNew ZealanderNicaraguanNigerianNorthern EuropeanNorwegianOkinawanOsageOttawaPaiutePakistaniPalestinianPanamanianParaguayanPennsylvania GermanPeruvianPimaPolishPortuguesePotawatomiPuebloPuerto RicanPuget Sound SalishRomanianRussianSalvadoranSamoanScandinavianScotch-IrishScottishSeminoleSenegaleseSerbianShoshoneSierra LeoneanSiouxSlavicSlovakSloveneSomaliSouth AfricanSouth AmericanSouth American IndianSoviet UnionSpaniardSpanishSpanish AmericanSpanish American IndianSri LankanSubsaharan AfricanSudaneseSwedishSwissSyrianTaiwaneseThaiTlingit-HaidaTohono O'OdhamTonganTrinidadian and TobagonianTsimshianTurkishU.S. Virgin IslanderUgandanUkrainianUruguayanUteVenezuelanVietnameseWelshWest IndianYakamaYaquiYugoslavianYumanYup'ikZimbabwean
Immigration
NonimmigrantsImmigrantsAfghanistanAfricaAlbaniaArgentinaArmeniaAsiaAustraliaAustriaBahamasBangladeshBarbadosBelarusBelgiumBelizeBoliviaBosnia and HerzegovinaBrazilBulgariaBurma/MyanmarCabo VerdeCambodiaCameroonCanadaCaribbeanCentral AmericaChileChinaColombiaCongoCosta RicaCroatiaCubaCzechoslovakiaDenmarkDominicaDominican RepublicEastern AfricaEastern AsiaEastern EuropeEcuadorEgyptEl SalvadorEnglandEritreaEthiopiaEuropeFijiFranceGermanyGhanaGreeceGrenadaGuatemalaGuyanaHaitiHondurasHong KongHungaryIndiaIndonesiaIranIraqIrelandIsraelItalyJamaicaJapanJordanKazakhstanKenyaKoreaKuwaitLaosLatin AmericaLatviaLebanonLiberiaLithuaniaMalaysiaMexicoMicronesiaMiddle AfricaMoldovaMoroccoNepalNetherlandsNicaraguaNigeriaNorth AmericaNorth MacedoniaNorthern AfricaNorthern EuropeNorwayOceaniaPakistanPanamaPeruPhilippinesPolandPortugalRomaniaRussiaSaudi ArabiaScotlandSenegalSerbiaSierra LeoneSingaporeSomaliaSouth AfricaSouth AmericaSouth Central AsiaSouth Eastern AsiaSouthern EuropeSpainSri LankaSt. Vincent and the GrenadinesSudanSwedenSwitzerlandSyriaTaiwanThailandTrinidad and TobagoTurkeyUgandaUkraineUruguayUzbekistanVietnamWest IndiesWestern AfricaWestern AsiaWestern EuropeYemenZaireZimbabweAzores
In Labor Force | Age 16-19
Income
Poverty
Unemployment
Labor Participation
Family Structure
Vehicle Availability
Education Level
Disability

In Labor Force | Age 16-19 Comparison

Immigrants from Venezuela

Immigrants from Bahamas

Tragic
Tragic
33.7%
IN LABOR FORCE | AGE 16-19
0.2/ 100
METRIC RATING
283rd/ 347
METRIC RANK
35.5%
IN LABOR FORCE | AGE 16-19
8.3/ 100
METRIC RATING
220th/ 347
METRIC RANK

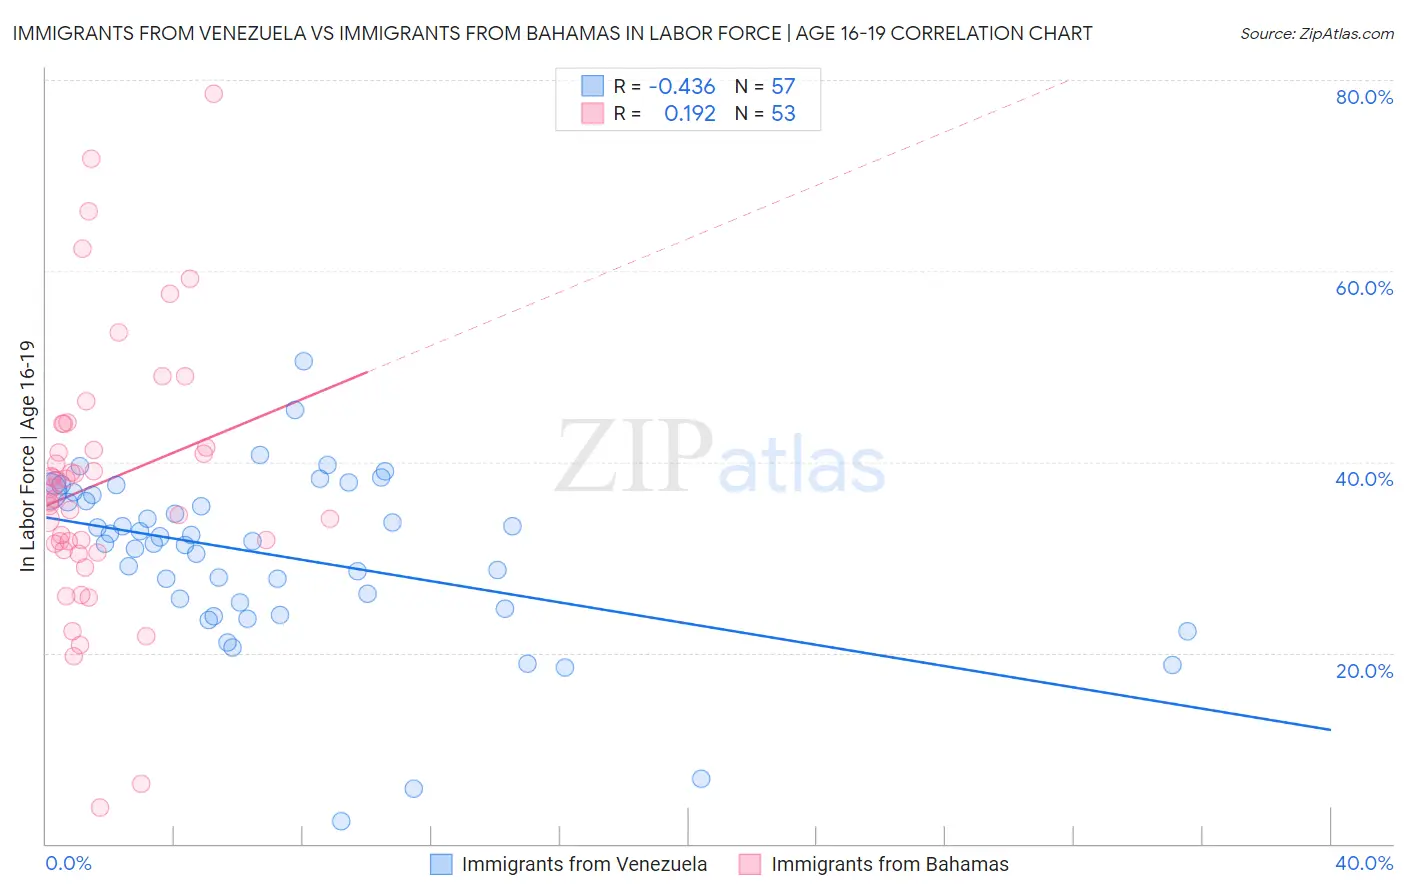
Immigrants from Venezuela vs Immigrants from Bahamas In Labor Force | Age 16-19 Correlation Chart

The statistical analysis conducted on geographies consisting of 287,600,436 people shows a moderate negative correlation between the proportion of Immigrants from Venezuela and labor force participation rate among population between the ages 16 and 19 in the United States with a correlation coefficient (R) of -0.436 and weighted average of 33.7%. Similarly, the statistical analysis conducted on geographies consisting of 104,625,160 people shows a poor positive correlation between the proportion of Immigrants from Bahamas and labor force participation rate among population between the ages 16 and 19 in the United States with a correlation coefficient (R) of 0.192 and weighted average of 35.5%, a difference of 5.2%.
Immigrants from Venezuela vs Immigrants from Bahamas In Labor Force | Age 16-19

In Labor Force | Age 16-19 Correlation Summary

MeasurementImmigrants from VenezuelaImmigrants from Bahamas
Minimum2.4%3.8%
Maximum50.5%78.5%
Range48.1%74.7%
Mean30.2%37.8%
Median31.7%36.7%
Interquartile 25% (IQ1)25.0%31.1%
Interquartile 75% (IQ3)36.7%42.7%
Interquartile Range (IQR)11.7%11.6%
Standard Deviation (Sample)9.0%13.9%
Standard Deviation (Population)8.9%13.7%

Similar Demographics by In Labor Force | Age 16-19

Demographics Similar to Immigrants from Venezuela by In Labor Force | Age 16-19

In terms of in labor force | age 16-19, the demographic groups most similar to Immigrants from Venezuela are Immigrants from Spain (33.7%, a difference of 0.060%), U.S. Virgin Islander (33.6%, a difference of 0.25%), South American (33.6%, a difference of 0.34%), Immigrants from Korea (33.8%, a difference of 0.35%), and Cypriot (33.8%, a difference of 0.36%).
DemographicsRating | RankIn Labor Force | Age 16-19
Immigrants | Latin America
0.3
/100
|
#276
Tragic
33.9%
Menominee
0.3
/100
|
#277
Tragic
33.9%
Colombians
0.3
/100
|
#278
Tragic
33.8%
Paraguayans
0.3
/100
|
#279
Tragic
33.8%
Taiwanese
0.3
/100
|
#280
Tragic
33.8%
Cypriots
0.3
/100
|
#281
Tragic
33.8%
Immigrants | Korea
0.3
/100
|
#282
Tragic
33.8%
Immigrants | Venezuela
0.2
/100
|
#283
Tragic
33.7%
Immigrants | Spain
0.2
/100
|
#284
Tragic
33.7%
U.S. Virgin Islanders
0.2
/100
|
#285
Tragic
33.6%
South Americans
0.2
/100
|
#286
Tragic
33.6%
Nepalese
0.1
/100
|
#287
Tragic
33.5%
Immigrants | Indonesia
0.1
/100
|
#288
Tragic
33.5%
Immigrants | Singapore
0.1
/100
|
#289
Tragic
33.5%
Immigrants | Colombia
0.1
/100
|
#290
Tragic
33.5%

Demographics Similar to Immigrants from Bahamas by In Labor Force | Age 16-19

In terms of in labor force | age 16-19, the demographic groups most similar to Immigrants from Bahamas are Guatemalan (35.5%, a difference of 0.060%), Turkish (35.4%, a difference of 0.18%), Immigrants from Ghana (35.4%, a difference of 0.19%), Sri Lankan (35.5%, a difference of 0.24%), and Ghanaian (35.3%, a difference of 0.33%).
DemographicsRating | RankIn Labor Force | Age 16-19
Immigrants | Bolivia
11.0
/100
|
#213
Poor
35.6%
Apache
11.0
/100
|
#214
Poor
35.6%
Immigrants | South Eastern Asia
10.8
/100
|
#215
Poor
35.6%
Dutch West Indians
10.7
/100
|
#216
Poor
35.6%
Immigrants | Costa Rica
10.7
/100
|
#217
Poor
35.6%
Sri Lankans
9.8
/100
|
#218
Tragic
35.5%
Guatemalans
8.6
/100
|
#219
Tragic
35.5%
Immigrants | Bahamas
8.3
/100
|
#220
Tragic
35.5%
Turks
7.3
/100
|
#221
Tragic
35.4%
Immigrants | Ghana
7.3
/100
|
#222
Tragic
35.4%
Ghanaians
6.5
/100
|
#223
Tragic
35.3%
Hondurans
6.5
/100
|
#224
Tragic
35.3%
Immigrants | Belgium
6.1
/100
|
#225
Tragic
35.3%
Immigrants | Guatemala
5.7
/100
|
#226
Tragic
35.3%
Mongolians
5.7
/100
|
#227
Tragic
35.3%