Immigrants from Switzerland vs Cape Verdean Unemployment Among Seniors over 65 years
COMPARE
Immigrants from Switzerland
Cape Verdean
Unemployment Among Seniors over 65 years
Unemployment Among Seniors over 65 years Comparison
Immigrants from Switzerland
Cape Verdeans
5.0%
UNEMPLOYMENT AMONG SENIORS OVER 65 YEARS
98.2/ 100
METRIC RATING
87th/ 347
METRIC RANK
5.5%
UNEMPLOYMENT AMONG SENIORS OVER 65 YEARS
0.0/ 100
METRIC RATING
296th/ 347
METRIC RANK
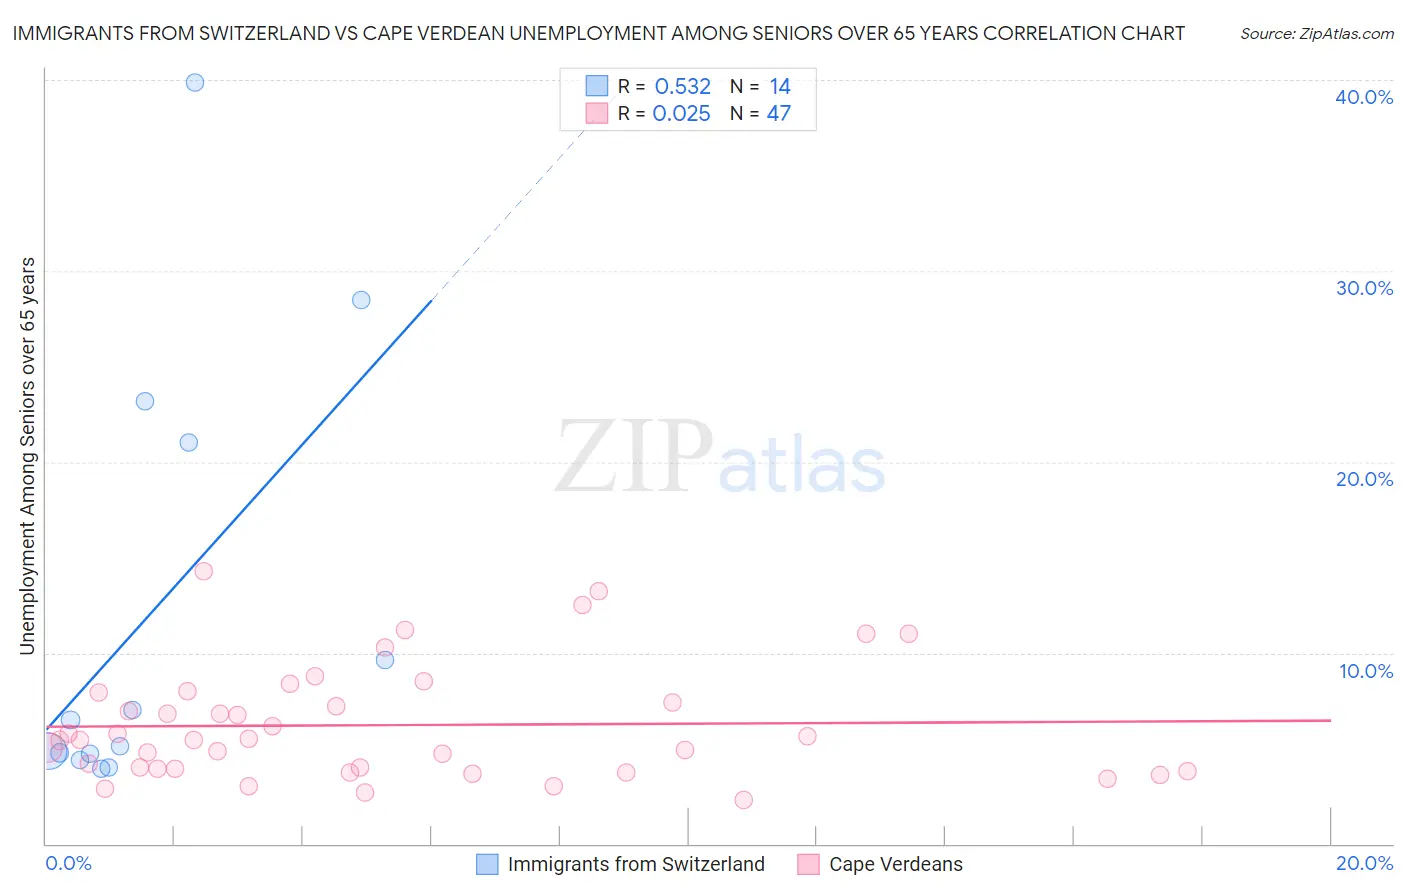
Immigrants from Switzerland vs Cape Verdean Unemployment Among Seniors over 65 years Correlation Chart
The statistical analysis conducted on geographies consisting of 141,778,502 people shows a substantial positive correlation between the proportion of Immigrants from Switzerland and unemployment rate amomg seniors over the age of 65 in the United States with a correlation coefficient (R) of 0.532 and weighted average of 5.0%. Similarly, the statistical analysis conducted on geographies consisting of 104,053,976 people shows no correlation between the proportion of Cape Verdeans and unemployment rate amomg seniors over the age of 65 in the United States with a correlation coefficient (R) of 0.025 and weighted average of 5.5%, a difference of 11.3%.
Unemployment Among Seniors over 65 years Correlation Summary
| Measurement | Immigrants from Switzerland | Cape Verdean |
| Minimum | 3.9% | 2.3% |
| Maximum | 39.9% | 14.3% |
| Range | 36.0% | 12.0% |
| Mean | 12.0% | 6.2% |
| Median | 5.8% | 5.4% |
| Interquartile 25% (IQ1) | 4.7% | 3.9% |
| Interquartile 75% (IQ3) | 21.0% | 7.9% |
| Interquartile Range (IQR) | 16.3% | 4.0% |
| Standard Deviation (Sample) | 11.5% | 3.0% |
| Standard Deviation (Population) | 11.1% | 2.9% |
Similar Demographics by Unemployment Among Seniors over 65 years
Demographics Similar to Immigrants from Switzerland by Unemployment Among Seniors over 65 years
In terms of unemployment among seniors over 65 years, the demographic groups most similar to Immigrants from Switzerland are Immigrants from Hungary (5.0%, a difference of 0.010%), Immigrants from Taiwan (5.0%, a difference of 0.010%), Filipino (5.0%, a difference of 0.070%), Immigrants from Zimbabwe (5.0%, a difference of 0.080%), and Serbian (5.0%, a difference of 0.12%).
| Demographics | Rating | Rank | Unemployment Among Seniors over 65 years |
| Immigrants | Ethiopia | 98.6 /100 | #80 | Exceptional 5.0% |
| Estonians | 98.5 /100 | #81 | Exceptional 5.0% |
| Serbians | 98.4 /100 | #82 | Exceptional 5.0% |
| Immigrants | Zimbabwe | 98.3 /100 | #83 | Exceptional 5.0% |
| Filipinos | 98.3 /100 | #84 | Exceptional 5.0% |
| Immigrants | Hungary | 98.2 /100 | #85 | Exceptional 5.0% |
| Immigrants | Taiwan | 98.2 /100 | #86 | Exceptional 5.0% |
| Immigrants | Switzerland | 98.2 /100 | #87 | Exceptional 5.0% |
| Afghans | 97.6 /100 | #88 | Exceptional 5.0% |
| Immigrants | South Central Asia | 97.6 /100 | #89 | Exceptional 5.0% |
| Immigrants | South Africa | 97.6 /100 | #90 | Exceptional 5.0% |
| Immigrants | Bolivia | 97.3 /100 | #91 | Exceptional 5.0% |
| Immigrants | Bulgaria | 97.3 /100 | #92 | Exceptional 5.0% |
| Austrians | 97.3 /100 | #93 | Exceptional 5.0% |
| Burmese | 96.8 /100 | #94 | Exceptional 5.0% |
Demographics Similar to Cape Verdeans by Unemployment Among Seniors over 65 years
In terms of unemployment among seniors over 65 years, the demographic groups most similar to Cape Verdeans are Cheyenne (5.5%, a difference of 0.010%), Yaqui (5.5%, a difference of 0.010%), Armenian (5.5%, a difference of 0.080%), Immigrants from Venezuela (5.5%, a difference of 0.11%), and Immigrants from West Indies (5.6%, a difference of 0.13%).
| Demographics | Rating | Rank | Unemployment Among Seniors over 65 years |
| Immigrants | Cabo Verde | 0.0 /100 | #289 | Tragic 5.5% |
| Jamaicans | 0.0 /100 | #290 | Tragic 5.5% |
| Blacks/African Americans | 0.0 /100 | #291 | Tragic 5.5% |
| Belizeans | 0.0 /100 | #292 | Tragic 5.5% |
| Immigrants | Venezuela | 0.0 /100 | #293 | Tragic 5.5% |
| Armenians | 0.0 /100 | #294 | Tragic 5.5% |
| Cheyenne | 0.0 /100 | #295 | Tragic 5.5% |
| Cape Verdeans | 0.0 /100 | #296 | Tragic 5.5% |
| Yaqui | 0.0 /100 | #297 | Tragic 5.5% |
| Immigrants | West Indies | 0.0 /100 | #298 | Tragic 5.6% |
| Guyanese | 0.0 /100 | #299 | Tragic 5.6% |
| Zimbabweans | 0.0 /100 | #300 | Tragic 5.6% |
| Hispanics or Latinos | 0.0 /100 | #301 | Tragic 5.6% |
| Guatemalans | 0.0 /100 | #302 | Tragic 5.6% |
| Immigrants | Latin America | 0.0 /100 | #303 | Tragic 5.6% |