Delaware vs Cape Verdean Unemployment Among Seniors over 65 years
COMPARE
Delaware
Cape Verdean
Unemployment Among Seniors over 65 years
Unemployment Among Seniors over 65 years Comparison
Delaware
Cape Verdeans
5.7%
UNEMPLOYMENT AMONG SENIORS OVER 65 YEARS
0.0/ 100
METRIC RATING
314th/ 347
METRIC RANK
5.5%
UNEMPLOYMENT AMONG SENIORS OVER 65 YEARS
0.0/ 100
METRIC RATING
296th/ 347
METRIC RANK
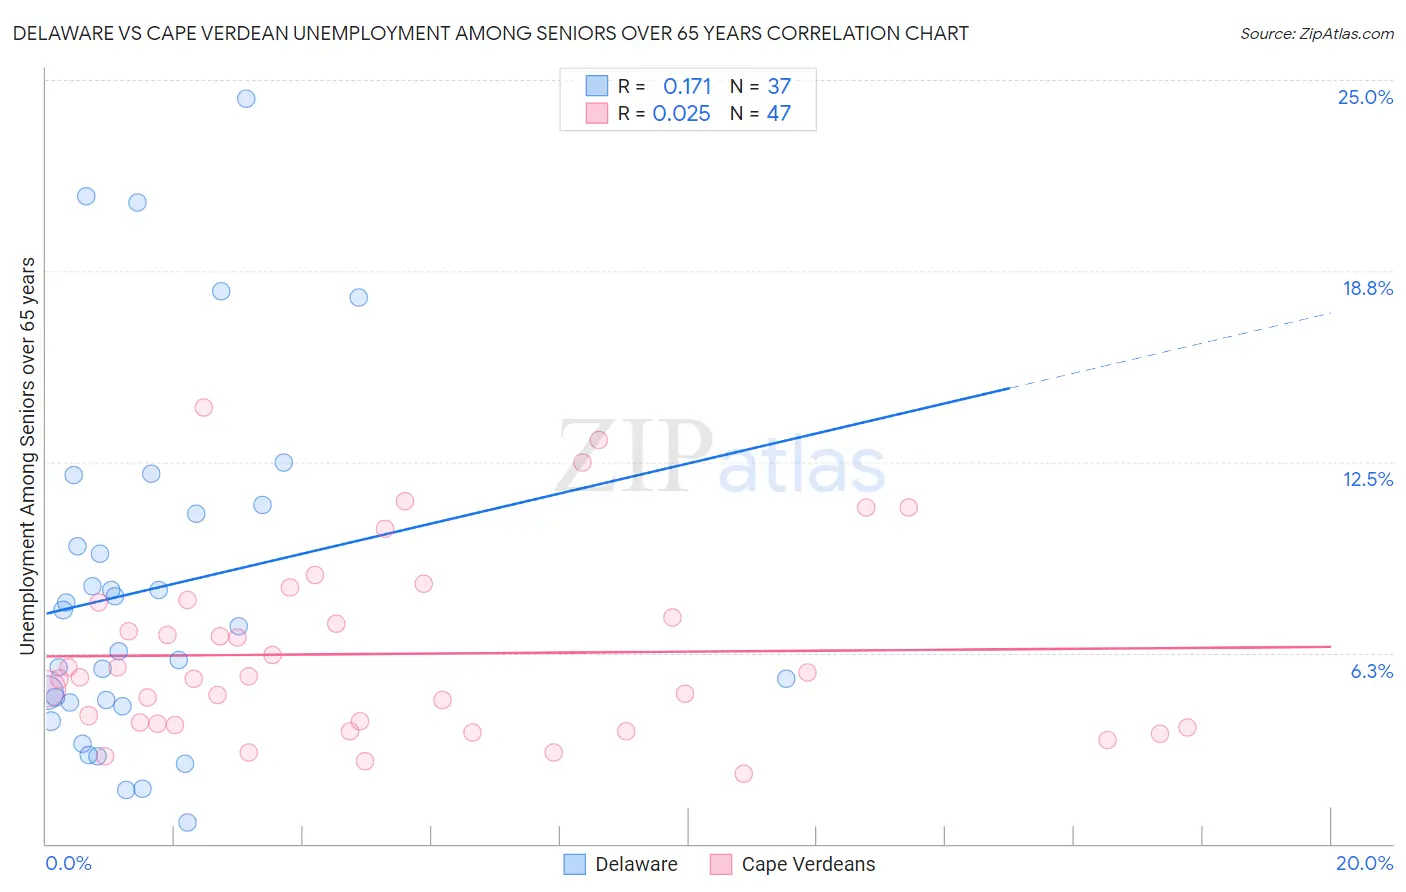
Delaware vs Cape Verdean Unemployment Among Seniors over 65 years Correlation Chart
The statistical analysis conducted on geographies consisting of 91,321,355 people shows a poor positive correlation between the proportion of Delaware and unemployment rate amomg seniors over the age of 65 in the United States with a correlation coefficient (R) of 0.171 and weighted average of 5.7%. Similarly, the statistical analysis conducted on geographies consisting of 104,053,976 people shows no correlation between the proportion of Cape Verdeans and unemployment rate amomg seniors over the age of 65 in the United States with a correlation coefficient (R) of 0.025 and weighted average of 5.5%, a difference of 2.2%.
Unemployment Among Seniors over 65 years Correlation Summary
| Measurement | Delaware | Cape Verdean |
| Minimum | 0.70% | 2.3% |
| Maximum | 24.4% | 14.3% |
| Range | 23.7% | 12.0% |
| Mean | 8.3% | 6.2% |
| Median | 7.1% | 5.4% |
| Interquartile 25% (IQ1) | 4.6% | 3.9% |
| Interquartile 75% (IQ3) | 11.0% | 7.9% |
| Interquartile Range (IQR) | 6.4% | 4.0% |
| Standard Deviation (Sample) | 5.8% | 3.0% |
| Standard Deviation (Population) | 5.7% | 2.9% |
Demographics Similar to Delaware and Cape Verdeans by Unemployment Among Seniors over 65 years
In terms of unemployment among seniors over 65 years, the demographic groups most similar to Delaware are Immigrants from El Salvador (5.7%, a difference of 0.030%), Barbadian (5.6%, a difference of 0.52%), Immigrants from Ecuador (5.6%, a difference of 0.55%), Immigrants from Guyana (5.6%, a difference of 0.68%), and Salvadoran (5.6%, a difference of 0.82%). Similarly, the demographic groups most similar to Cape Verdeans are Cheyenne (5.5%, a difference of 0.010%), Yaqui (5.5%, a difference of 0.010%), Immigrants from West Indies (5.6%, a difference of 0.13%), Guyanese (5.6%, a difference of 0.22%), and Zimbabwean (5.6%, a difference of 0.27%).
| Demographics | Rating | Rank | Unemployment Among Seniors over 65 years |
| Cheyenne | 0.0 /100 | #295 | Tragic 5.5% |
| Cape Verdeans | 0.0 /100 | #296 | Tragic 5.5% |
| Yaqui | 0.0 /100 | #297 | Tragic 5.5% |
| Immigrants | West Indies | 0.0 /100 | #298 | Tragic 5.6% |
| Guyanese | 0.0 /100 | #299 | Tragic 5.6% |
| Zimbabweans | 0.0 /100 | #300 | Tragic 5.6% |
| Hispanics or Latinos | 0.0 /100 | #301 | Tragic 5.6% |
| Guatemalans | 0.0 /100 | #302 | Tragic 5.6% |
| Immigrants | Latin America | 0.0 /100 | #303 | Tragic 5.6% |
| Liberians | 0.0 /100 | #304 | Tragic 5.6% |
| Mexicans | 0.0 /100 | #305 | Tragic 5.6% |
| Ecuadorians | 0.0 /100 | #306 | Tragic 5.6% |
| Portuguese | 0.0 /100 | #307 | Tragic 5.6% |
| Immigrants | St. Vincent and the Grenadines | 0.0 /100 | #308 | Tragic 5.6% |
| Immigrants | Guatemala | 0.0 /100 | #309 | Tragic 5.6% |
| Salvadorans | 0.0 /100 | #310 | Tragic 5.6% |
| Immigrants | Guyana | 0.0 /100 | #311 | Tragic 5.6% |
| Immigrants | Ecuador | 0.0 /100 | #312 | Tragic 5.6% |
| Barbadians | 0.0 /100 | #313 | Tragic 5.6% |
| Delaware | 0.0 /100 | #314 | Tragic 5.7% |
| Immigrants | El Salvador | 0.0 /100 | #315 | Tragic 5.7% |