Immigrants from Sudan vs Iroquois Unemployment

COMPARE

Immigrants from Sudan
Race
Ancestry
AfghanAfricanAlaska NativeAlaskan AthabascanAlbanianAleutAlsatianAmericanApacheArabArapahoArgentineanArmenianAssyrian/Chaldean/SyriacAustralianAustrianBahamianBangladeshiBarbadianBasqueBelgianBelizeanBermudanBhutaneseBlackfeetBolivianBrazilianBritishBritish West IndianBulgarianBurmeseCajunCambodianCanadianCape VerdeanCarpatho RusynCelticCentral AmericanCentral American IndianCherokeeCheyenneChickasawChileanChineseChippewaChoctawColombianColvilleComancheCosta RicanCreeCreekCroatianCrowCubanCypriotCzechCzechoslovakianDanishDelawareDominicanDutchDutch West IndianEastern EuropeanEcuadorianEgyptianEnglishEstonianEthiopianEuropeanFijianFilipinoFinnishFrenchFrench American IndianFrench CanadianGermanGerman RussianGhanaianGreekGuamanian/ChamorroGuatemalanGuyaneseHaitianHmongHonduranHopiHoumaHungarianIcelanderIndian (Asian)IndonesianInupiatIranianIraqiIrishIsraeliItalianJamaicanJapaneseJordanianKenyanKiowaKoreanLaotianLatvianLebaneseLiberianLithuanianLumbeeLuxembourgerMacedonianMalaysianMalteseMarshalleseMenomineeMexicanMexican American IndianMongolianMoroccanNative HawaiianNavajoNepaleseNew ZealanderNicaraguanNigerianNorthern EuropeanNorwegianOkinawanOsageOttawaPaiutePakistaniPalestinianPanamanianParaguayanPennsylvania GermanPeruvianPimaPolishPortuguesePotawatomiPuebloPuerto RicanPuget Sound SalishRomanianRussianSalvadoranSamoanScandinavianScotch-IrishScottishSeminoleSenegaleseSerbianShoshoneSierra LeoneanSiouxSlavicSlovakSloveneSomaliSouth AfricanSouth AmericanSouth American IndianSoviet UnionSpaniardSpanishSpanish AmericanSpanish American IndianSri LankanSubsaharan AfricanSudaneseSwedishSwissSyrianTaiwaneseThaiTlingit-HaidaTohono O'OdhamTonganTrinidadian and TobagonianTsimshianTurkishU.S. Virgin IslanderUgandanUkrainianUruguayanUteVenezuelanVietnameseWelshWest IndianYakamaYaquiYugoslavianYumanYup'ikZimbabwean
Immigration
NonimmigrantsImmigrantsAfghanistanAfricaAlbaniaArgentinaArmeniaAsiaAustraliaAustriaBahamasBangladeshBarbadosBelarusBelgiumBelizeBoliviaBosnia and HerzegovinaBrazilBulgariaBurma/MyanmarCabo VerdeCambodiaCameroonCanadaCaribbeanCentral AmericaChileChinaColombiaCongoCosta RicaCroatiaCubaCzechoslovakiaDenmarkDominicaDominican RepublicEastern AfricaEastern AsiaEastern EuropeEcuadorEgyptEl SalvadorEnglandEritreaEthiopiaEuropeFijiFranceGermanyGhanaGreeceGrenadaGuatemalaGuyanaHaitiHondurasHong KongHungaryIndiaIndonesiaIranIraqIrelandIsraelItalyJamaicaJapanJordanKazakhstanKenyaKoreaKuwaitLaosLatin AmericaLatviaLebanonLiberiaLithuaniaMalaysiaMexicoMicronesiaMiddle AfricaMoldovaMoroccoNepalNetherlandsNicaraguaNigeriaNorth AmericaNorth MacedoniaNorthern AfricaNorthern EuropeNorwayOceaniaPakistanPanamaPeruPhilippinesPolandPortugalRomaniaRussiaSaudi ArabiaScotlandSenegalSerbiaSierra LeoneSingaporeSomaliaSouth AfricaSouth AmericaSouth Central AsiaSouth Eastern AsiaSouthern EuropeSpainSri LankaSt. Vincent and the GrenadinesSudanSwedenSwitzerlandSyriaTaiwanThailandTrinidad and TobagoTurkeyUgandaUkraineUruguayUzbekistanVenezuelaVietnamWest IndiesWestern AfricaWestern AsiaWestern EuropeYemenZaireZimbabweAzores
Iroquois
Race
Ancestry
AfghanAfricanAlaska NativeAlaskan AthabascanAlbanianAleutAlsatianAmericanApacheArabArapahoArgentineanArmenianAssyrian/Chaldean/SyriacAustralianAustrianBahamianBangladeshiBarbadianBasqueBelgianBelizeanBermudanBhutaneseBlackfeetBolivianBrazilianBritishBritish West IndianBulgarianBurmeseCajunCambodianCanadianCape VerdeanCarpatho RusynCelticCentral AmericanCentral American IndianCherokeeCheyenneChickasawChileanChineseChippewaChoctawColombianColvilleComancheCosta RicanCreeCreekCroatianCrowCubanCypriotCzechCzechoslovakianDanishDelawareDominicanDutchDutch West IndianEastern EuropeanEcuadorianEgyptianEnglishEstonianEthiopianEuropeanFijianFilipinoFinnishFrenchFrench American IndianFrench CanadianGermanGerman RussianGhanaianGreekGuamanian/ChamorroGuatemalanGuyaneseHaitianHmongHonduranHopiHoumaHungarianIcelanderIndian (Asian)IndonesianInupiatIranianIraqiIrishIroquoisIsraeliItalianJamaicanJapaneseJordanianKenyanKiowaKoreanLaotianLatvianLebaneseLiberianLithuanianLumbeeLuxembourgerMacedonianMalaysianMalteseMarshalleseMenomineeMexicanMexican American IndianMongolianMoroccanNative HawaiianNavajoNepaleseNew ZealanderNicaraguanNigerianNorthern EuropeanNorwegianOkinawanOsageOttawaPaiutePakistaniPalestinianPanamanianParaguayanPennsylvania GermanPeruvianPimaPolishPortuguesePotawatomiPuebloPuerto RicanPuget Sound SalishRomanianRussianSalvadoranSamoanScandinavianScotch-IrishScottishSeminoleSenegaleseSerbianShoshoneSierra LeoneanSiouxSlavicSlovakSloveneSomaliSouth AfricanSouth AmericanSouth American IndianSoviet UnionSpaniardSpanishSpanish AmericanSpanish American IndianSri LankanSubsaharan AfricanSudaneseSwedishSwissSyrianTaiwaneseThaiTlingit-HaidaTohono O'OdhamTonganTrinidadian and TobagonianTsimshianTurkishU.S. Virgin IslanderUgandanUkrainianUruguayanUteVenezuelanVietnameseWelshWest IndianYakamaYaquiYugoslavianYumanYup'ikZimbabwean
Immigration
NonimmigrantsImmigrantsAfghanistanAfricaAlbaniaArgentinaArmeniaAsiaAustraliaAustriaBahamasBangladeshBarbadosBelarusBelgiumBelizeBoliviaBosnia and HerzegovinaBrazilBulgariaBurma/MyanmarCabo VerdeCambodiaCameroonCanadaCaribbeanCentral AmericaChileChinaColombiaCongoCosta RicaCroatiaCubaCzechoslovakiaDenmarkDominicaDominican RepublicEastern AfricaEastern AsiaEastern EuropeEcuadorEgyptEl SalvadorEnglandEritreaEthiopiaEuropeFijiFranceGermanyGhanaGreeceGrenadaGuatemalaGuyanaHaitiHondurasHong KongHungaryIndiaIndonesiaIranIraqIrelandIsraelItalyJamaicaJapanJordanKazakhstanKenyaKoreaKuwaitLaosLatin AmericaLatviaLebanonLiberiaLithuaniaMalaysiaMexicoMicronesiaMiddle AfricaMoldovaMoroccoNepalNetherlandsNicaraguaNigeriaNorth AmericaNorth MacedoniaNorthern AfricaNorthern EuropeNorwayOceaniaPakistanPanamaPeruPhilippinesPolandPortugalRomaniaRussiaSaudi ArabiaScotlandSenegalSerbiaSierra LeoneSingaporeSomaliaSouth AfricaSouth AmericaSouth Central AsiaSouth Eastern AsiaSouthern EuropeSpainSri LankaSt. Vincent and the GrenadinesSwedenSwitzerlandSyriaTaiwanThailandTrinidad and TobagoTurkeyUgandaUkraineUruguayUzbekistanVenezuelaVietnamWest IndiesWestern AfricaWestern AsiaWestern EuropeYemenZaireZimbabweAzores
Unemployment
Income
Poverty
Unemployment
Labor Participation
Family Structure
Vehicle Availability
Education Level
Disability

Unemployment Comparison

Immigrants from Sudan

Iroquois

Exceptional
Poor
5.0%
UNEMPLOYMENT
96.3/ 100
METRIC RATING
91st/ 347
METRIC RANK
5.4%
UNEMPLOYMENT
10.3/ 100
METRIC RATING
222nd/ 347
METRIC RANK

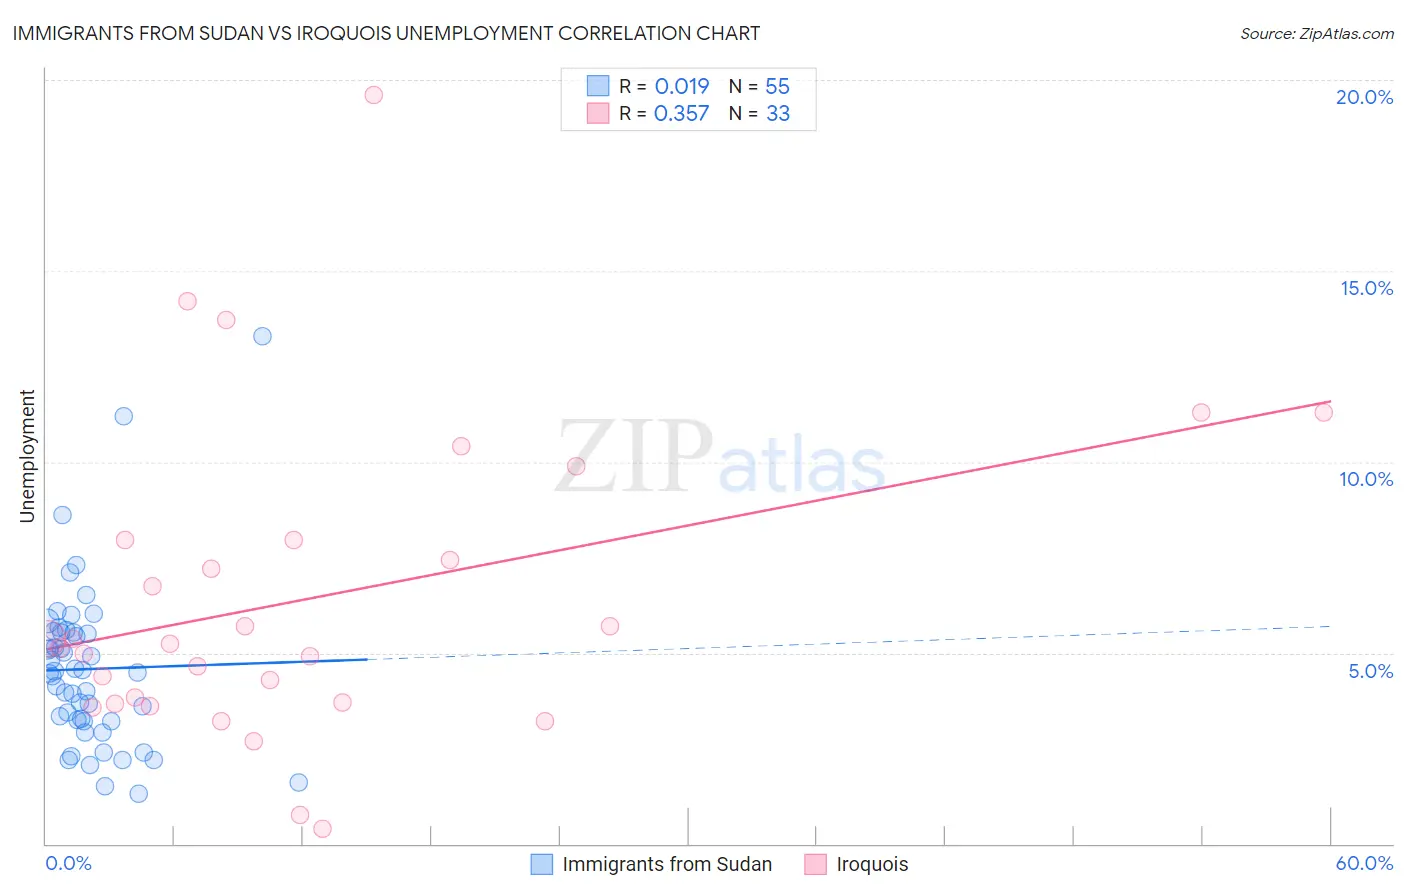
Immigrants from Sudan vs Iroquois Unemployment Correlation Chart

The statistical analysis conducted on geographies consisting of 118,944,450 people shows no correlation between the proportion of Immigrants from Sudan and unemployment in the United States with a correlation coefficient (R) of 0.019 and weighted average of 5.0%. Similarly, the statistical analysis conducted on geographies consisting of 207,134,064 people shows a mild positive correlation between the proportion of Iroquois and unemployment in the United States with a correlation coefficient (R) of 0.357 and weighted average of 5.4%, a difference of 8.8%.
Immigrants from Sudan vs Iroquois Unemployment

Unemployment Correlation Summary

MeasurementImmigrants from SudanIroquois
Minimum1.3%0.40%
Maximum13.3%19.6%
Range12.0%19.2%
Mean4.6%6.4%
Median4.5%5.2%
Interquartile 25% (IQ1)3.2%3.7%
Interquartile 75% (IQ3)5.5%7.9%
Interquartile Range (IQR)2.3%4.3%
Standard Deviation (Sample)2.2%4.1%
Standard Deviation (Population)2.2%4.0%

Similar Demographics by Unemployment

Demographics Similar to Immigrants from Sudan by Unemployment

In terms of unemployment, the demographic groups most similar to Immigrants from Sudan are Immigrants from North Macedonia (5.0%, a difference of 0.010%), Immigrants from South Africa (5.0%, a difference of 0.020%), Jordanian (5.0%, a difference of 0.050%), Ukrainian (5.0%, a difference of 0.11%), and Immigrants from Korea (5.0%, a difference of 0.14%).
DemographicsRating | RankUnemployment
Russians
97.4
/100
|
#84
Exceptional
5.0%
Immigrants | Australia
97.0
/100
|
#85
Exceptional
5.0%
Hungarians
96.9
/100
|
#86
Exceptional
5.0%
Immigrants | Moldova
96.6
/100
|
#87
Exceptional
5.0%
Immigrants | Korea
96.6
/100
|
#88
Exceptional
5.0%
Jordanians
96.4
/100
|
#89
Exceptional
5.0%
Immigrants | North Macedonia
96.3
/100
|
#90
Exceptional
5.0%
Immigrants | Sudan
96.3
/100
|
#91
Exceptional
5.0%
Immigrants | South Africa
96.2
/100
|
#92
Exceptional
5.0%
Ukrainians
96.0
/100
|
#93
Exceptional
5.0%
Immigrants | Austria
95.9
/100
|
#94
Exceptional
5.0%
Immigrants | Serbia
95.6
/100
|
#95
Exceptional
5.0%
Immigrants | England
95.2
/100
|
#96
Exceptional
5.0%
Immigrants | Czechoslovakia
95.1
/100
|
#97
Exceptional
5.0%
Romanians
95.0
/100
|
#98
Exceptional
5.0%

Demographics Similar to Iroquois by Unemployment

In terms of unemployment, the demographic groups most similar to Iroquois are Immigrants from Philippines (5.4%, a difference of 0.020%), Soviet Union (5.4%, a difference of 0.060%), Bangladeshi (5.4%, a difference of 0.14%), Seminole (5.4%, a difference of 0.18%), and Israeli (5.4%, a difference of 0.25%).
DemographicsRating | RankUnemployment
Delaware
14.7
/100
|
#215
Poor
5.4%
Immigrants | South America
13.5
/100
|
#216
Poor
5.4%
Immigrants | Albania
13.5
/100
|
#217
Poor
5.4%
Choctaw
12.7
/100
|
#218
Poor
5.4%
Bangladeshis
11.2
/100
|
#219
Poor
5.4%
Soviet Union
10.6
/100
|
#220
Poor
5.4%
Immigrants | Philippines
10.4
/100
|
#221
Poor
5.4%
Iroquois
10.3
/100
|
#222
Poor
5.4%
Seminole
9.2
/100
|
#223
Tragic
5.4%
Israelis
8.8
/100
|
#224
Tragic
5.4%
South American Indians
7.8
/100
|
#225
Tragic
5.5%
Samoans
7.1
/100
|
#226
Tragic
5.5%
Immigrants | Lebanon
7.0
/100
|
#227
Tragic
5.5%
Guamanians/Chamorros
6.3
/100
|
#228
Tragic
5.5%
Hawaiians
5.4
/100
|
#229
Tragic
5.5%