Immigrants from St. Vincent and the Grenadines vs Asian Unemployment Among Seniors over 75 years
COMPARE
Immigrants from St. Vincent and the Grenadines
Asian
Unemployment Among Seniors over 75 years
Unemployment Among Seniors over 75 years Comparison
Immigrants from St. Vincent and the Grenadines
Asians
9.8%
UNEMPLOYMENT AMONG SENIORS OVER 75 YEARS
0.0/ 100
METRIC RATING
296th/ 347
METRIC RANK
8.3%
UNEMPLOYMENT AMONG SENIORS OVER 75 YEARS
98.5/ 100
METRIC RATING
113th/ 347
METRIC RANK
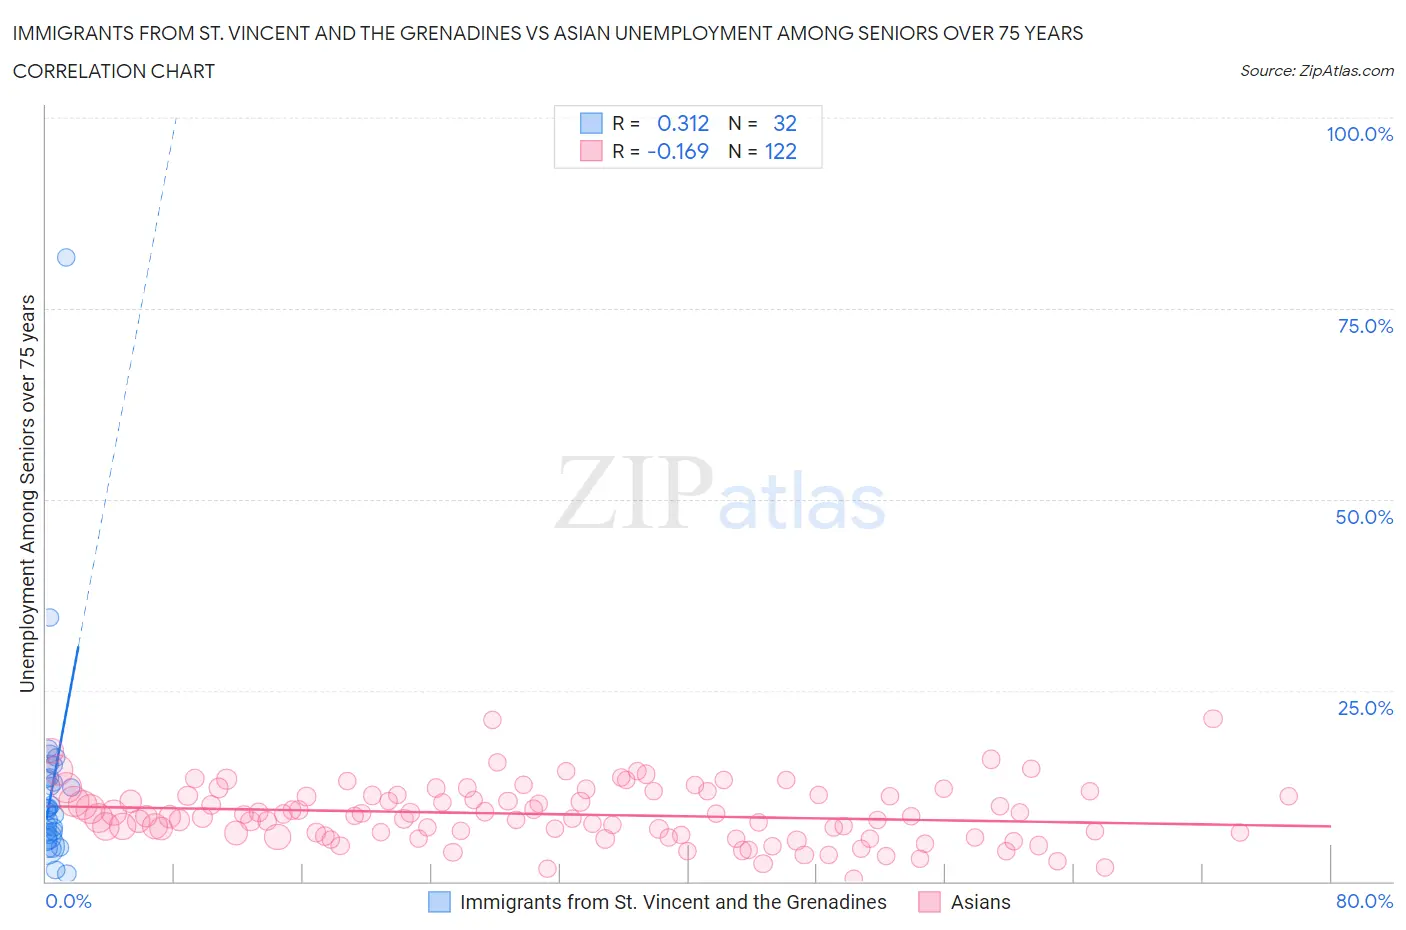
Immigrants from St. Vincent and the Grenadines vs Asian Unemployment Among Seniors over 75 years Correlation Chart
The statistical analysis conducted on geographies consisting of 44,044,285 people shows a mild positive correlation between the proportion of Immigrants from St. Vincent and the Grenadines and unemployment rate among seniors over the age of 75 in the United States with a correlation coefficient (R) of 0.312 and weighted average of 9.8%. Similarly, the statistical analysis conducted on geographies consisting of 233,630,058 people shows a poor negative correlation between the proportion of Asians and unemployment rate among seniors over the age of 75 in the United States with a correlation coefficient (R) of -0.169 and weighted average of 8.3%, a difference of 19.2%.
Unemployment Among Seniors over 75 years Correlation Summary
| Measurement | Immigrants from St. Vincent and the Grenadines | Asian |
| Minimum | 1.0% | 0.40% |
| Maximum | 81.7% | 21.3% |
| Range | 80.7% | 20.9% |
| Mean | 12.2% | 8.8% |
| Median | 9.3% | 8.5% |
| Interquartile 25% (IQ1) | 6.0% | 6.0% |
| Interquartile 75% (IQ3) | 13.5% | 11.2% |
| Interquartile Range (IQR) | 7.5% | 5.2% |
| Standard Deviation (Sample) | 14.2% | 3.8% |
| Standard Deviation (Population) | 13.9% | 3.8% |
Similar Demographics by Unemployment Among Seniors over 75 years
Demographics Similar to Immigrants from St. Vincent and the Grenadines by Unemployment Among Seniors over 75 years
In terms of unemployment among seniors over 75 years, the demographic groups most similar to Immigrants from St. Vincent and the Grenadines are Nonimmigrants (9.8%, a difference of 0.050%), Cherokee (9.8%, a difference of 0.080%), Immigrants from Dominica (9.8%, a difference of 0.41%), Lithuanian (9.9%, a difference of 0.46%), and Norwegian (9.8%, a difference of 0.47%).
| Demographics | Rating | Rank | Unemployment Among Seniors over 75 years |
| Czechs | 0.0 /100 | #289 | Tragic 9.7% |
| Sioux | 0.0 /100 | #290 | Tragic 9.7% |
| Scandinavians | 0.0 /100 | #291 | Tragic 9.7% |
| Immigrants | Western Africa | 0.0 /100 | #292 | Tragic 9.8% |
| Norwegians | 0.0 /100 | #293 | Tragic 9.8% |
| Immigrants | Dominica | 0.0 /100 | #294 | Tragic 9.8% |
| Immigrants | Nonimmigrants | 0.0 /100 | #295 | Tragic 9.8% |
| Immigrants | St. Vincent and the Grenadines | 0.0 /100 | #296 | Tragic 9.8% |
| Cherokee | 0.0 /100 | #297 | Tragic 9.8% |
| Lithuanians | 0.0 /100 | #298 | Tragic 9.9% |
| Belgians | 0.0 /100 | #299 | Tragic 9.9% |
| Iraqis | 0.0 /100 | #300 | Tragic 9.9% |
| Welsh | 0.0 /100 | #301 | Tragic 10.0% |
| Finns | 0.0 /100 | #302 | Tragic 10.0% |
| Puget Sound Salish | 0.0 /100 | #303 | Tragic 10.0% |
Demographics Similar to Asians by Unemployment Among Seniors over 75 years
In terms of unemployment among seniors over 75 years, the demographic groups most similar to Asians are Immigrants from India (8.2%, a difference of 0.060%), Trinidadian and Tobagonian (8.3%, a difference of 0.15%), French American Indian (8.2%, a difference of 0.18%), Marshallese (8.2%, a difference of 0.23%), and Immigrants from Lebanon (8.2%, a difference of 0.26%).
| Demographics | Rating | Rank | Unemployment Among Seniors over 75 years |
| Immigrants | Honduras | 99.0 /100 | #106 | Exceptional 8.2% |
| Sri Lankans | 98.9 /100 | #107 | Exceptional 8.2% |
| Laotians | 98.8 /100 | #108 | Exceptional 8.2% |
| Immigrants | Lebanon | 98.8 /100 | #109 | Exceptional 8.2% |
| Marshallese | 98.7 /100 | #110 | Exceptional 8.2% |
| French American Indians | 98.7 /100 | #111 | Exceptional 8.2% |
| Immigrants | India | 98.6 /100 | #112 | Exceptional 8.2% |
| Asians | 98.5 /100 | #113 | Exceptional 8.3% |
| Trinidadians and Tobagonians | 98.4 /100 | #114 | Exceptional 8.3% |
| Sudanese | 98.2 /100 | #115 | Exceptional 8.3% |
| Immigrants | West Indies | 98.1 /100 | #116 | Exceptional 8.3% |
| Immigrants | Greece | 97.9 /100 | #117 | Exceptional 8.3% |
| Immigrants | Middle Africa | 97.9 /100 | #118 | Exceptional 8.3% |
| Japanese | 97.5 /100 | #119 | Exceptional 8.3% |
| Immigrants | Asia | 97.4 /100 | #120 | Exceptional 8.3% |