Immigrants from St. Vincent and the Grenadines vs Asian Kindergarten
COMPARE
Immigrants from St. Vincent and the Grenadines
Asian
Kindergarten
Kindergarten Comparison
Immigrants from St. Vincent and the Grenadines
Asians
97.3%
KINDERGARTEN
0.0/ 100
METRIC RATING
290th/ 347
METRIC RANK
97.6%
KINDERGARTEN
1.2/ 100
METRIC RATING
243rd/ 347
METRIC RANK
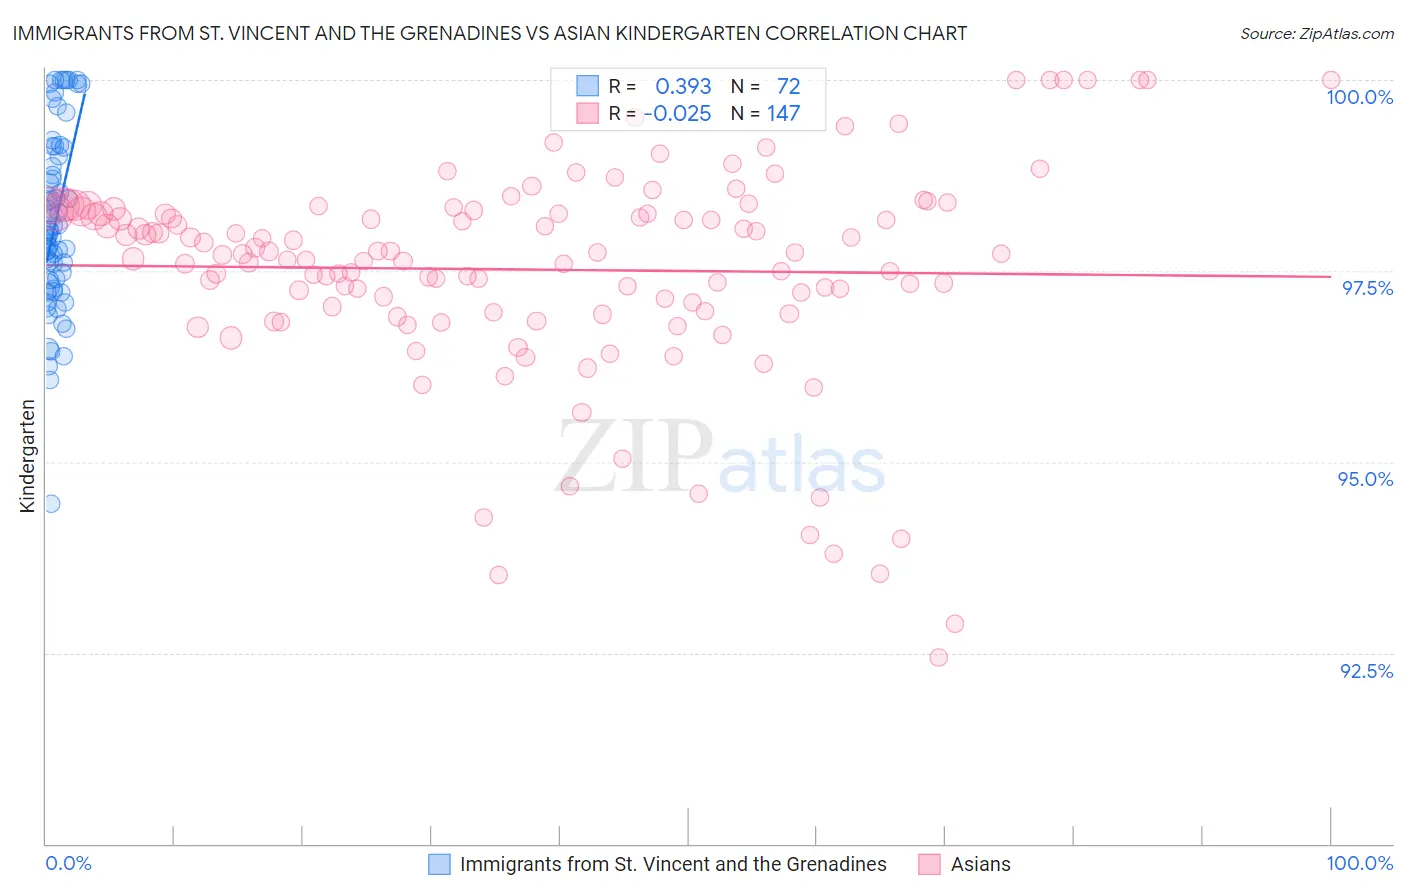
Immigrants from St. Vincent and the Grenadines vs Asian Kindergarten Correlation Chart
The statistical analysis conducted on geographies consisting of 56,176,062 people shows a mild positive correlation between the proportion of Immigrants from St. Vincent and the Grenadines and percentage of population with at least kindergarten education in the United States with a correlation coefficient (R) of 0.393 and weighted average of 97.3%. Similarly, the statistical analysis conducted on geographies consisting of 550,722,447 people shows no correlation between the proportion of Asians and percentage of population with at least kindergarten education in the United States with a correlation coefficient (R) of -0.025 and weighted average of 97.6%, a difference of 0.34%.
Kindergarten Correlation Summary
| Measurement | Immigrants from St. Vincent and the Grenadines | Asian |
| Minimum | 94.4% | 92.4% |
| Maximum | 100.0% | 100.0% |
| Range | 5.6% | 7.6% |
| Mean | 98.1% | 97.5% |
| Median | 98.0% | 97.7% |
| Interquartile 25% (IQ1) | 97.3% | 97.0% |
| Interquartile 75% (IQ3) | 99.1% | 98.3% |
| Interquartile Range (IQR) | 1.7% | 1.3% |
| Standard Deviation (Sample) | 1.2% | 1.4% |
| Standard Deviation (Population) | 1.2% | 1.4% |
Similar Demographics by Kindergarten
Demographics Similar to Immigrants from St. Vincent and the Grenadines by Kindergarten
In terms of kindergarten, the demographic groups most similar to Immigrants from St. Vincent and the Grenadines are Immigrants from Afghanistan (97.3%, a difference of 0.010%), Houma (97.3%, a difference of 0.020%), Immigrants from Thailand (97.3%, a difference of 0.030%), British West Indian (97.3%, a difference of 0.030%), and Immigrants from Barbados (97.3%, a difference of 0.040%).
| Demographics | Rating | Rank | Kindergarten |
| Immigrants | West Indies | 0.0 /100 | #283 | Tragic 97.3% |
| Immigrants | Trinidad and Tobago | 0.0 /100 | #284 | Tragic 97.3% |
| Immigrants | Portugal | 0.0 /100 | #285 | Tragic 97.3% |
| Immigrants | Barbados | 0.0 /100 | #286 | Tragic 97.3% |
| Immigrants | Hong Kong | 0.0 /100 | #287 | Tragic 97.3% |
| Immigrants | Thailand | 0.0 /100 | #288 | Tragic 97.3% |
| Immigrants | Afghanistan | 0.0 /100 | #289 | Tragic 97.3% |
| Immigrants | St. Vincent and the Grenadines | 0.0 /100 | #290 | Tragic 97.3% |
| Houma | 0.0 /100 | #291 | Tragic 97.3% |
| British West Indians | 0.0 /100 | #292 | Tragic 97.3% |
| Malaysians | 0.0 /100 | #293 | Tragic 97.2% |
| Immigrants | Immigrants | 0.0 /100 | #294 | Tragic 97.2% |
| Immigrants | Grenada | 0.0 /100 | #295 | Tragic 97.2% |
| Immigrants | Eritrea | 0.0 /100 | #296 | Tragic 97.2% |
| Central American Indians | 0.0 /100 | #297 | Tragic 97.2% |
Demographics Similar to Asians by Kindergarten
In terms of kindergarten, the demographic groups most similar to Asians are Bolivian (97.6%, a difference of 0.0%), Liberian (97.6%, a difference of 0.010%), Immigrants from Indonesia (97.6%, a difference of 0.010%), South American (97.6%, a difference of 0.010%), and Indian (Asian) (97.6%, a difference of 0.010%).
| Demographics | Rating | Rank | Kindergarten |
| Immigrants | Western Asia | 2.1 /100 | #236 | Tragic 97.7% |
| Nigerians | 1.8 /100 | #237 | Tragic 97.6% |
| Immigrants | Eastern Asia | 1.7 /100 | #238 | Tragic 97.6% |
| U.S. Virgin Islanders | 1.7 /100 | #239 | Tragic 97.6% |
| Koreans | 1.6 /100 | #240 | Tragic 97.6% |
| Liberians | 1.3 /100 | #241 | Tragic 97.6% |
| Immigrants | Indonesia | 1.3 /100 | #242 | Tragic 97.6% |
| Asians | 1.2 /100 | #243 | Tragic 97.6% |
| Bolivians | 1.2 /100 | #244 | Tragic 97.6% |
| South Americans | 1.1 /100 | #245 | Tragic 97.6% |
| Indians (Asian) | 1.0 /100 | #246 | Tragic 97.6% |
| Immigrants | Eastern Africa | 1.0 /100 | #247 | Tragic 97.6% |
| Immigrants | Middle Africa | 1.0 /100 | #248 | Tragic 97.6% |
| Peruvians | 1.0 /100 | #249 | Tragic 97.6% |
| Immigrants | Senegal | 0.9 /100 | #250 | Tragic 97.6% |