Immigrants from North America vs Czechoslovakian Unemployment Among Ages 30 to 34 years
COMPARE
Immigrants from North America
Czechoslovakian
Unemployment Among Ages 30 to 34 years
Unemployment Among Ages 30 to 34 years Comparison
Immigrants from North America
Czechoslovakians
5.4%
UNEMPLOYMENT AMONG AGES 30 TO 34 YEARS
72.2/ 100
METRIC RATING
140th/ 347
METRIC RANK
5.4%
UNEMPLOYMENT AMONG AGES 30 TO 34 YEARS
63.7/ 100
METRIC RATING
156th/ 347
METRIC RANK
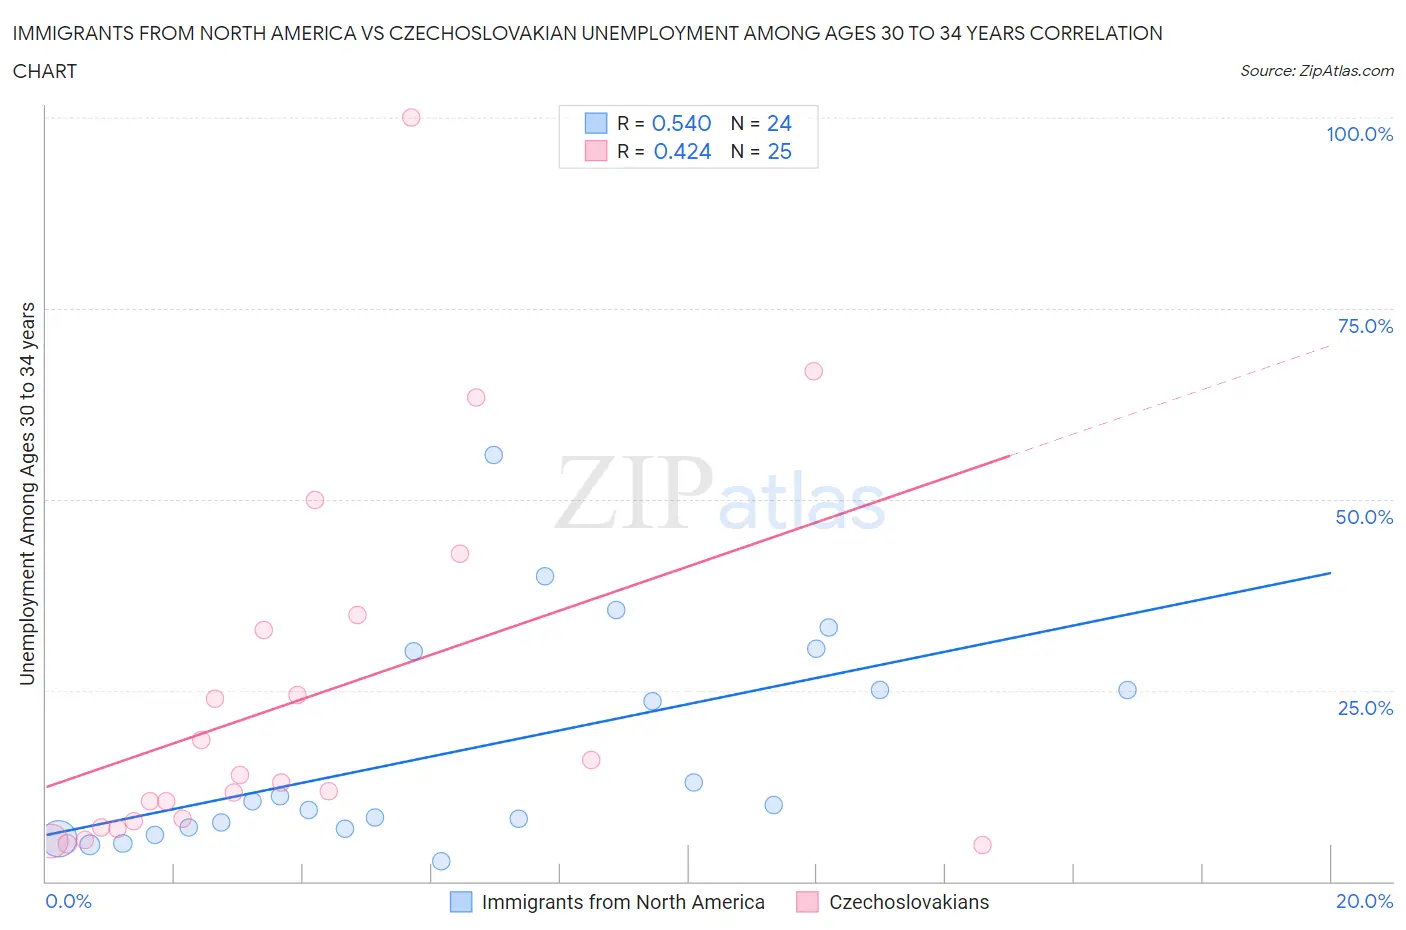
Immigrants from North America vs Czechoslovakian Unemployment Among Ages 30 to 34 years Correlation Chart
The statistical analysis conducted on geographies consisting of 425,298,151 people shows a substantial positive correlation between the proportion of Immigrants from North America and unemployment rate among population between the ages 30 and 34 in the United States with a correlation coefficient (R) of 0.540 and weighted average of 5.4%. Similarly, the statistical analysis conducted on geographies consisting of 343,116,341 people shows a moderate positive correlation between the proportion of Czechoslovakians and unemployment rate among population between the ages 30 and 34 in the United States with a correlation coefficient (R) of 0.424 and weighted average of 5.4%, a difference of 0.69%.
Unemployment Among Ages 30 to 34 years Correlation Summary
| Measurement | Immigrants from North America | Czechoslovakian |
| Minimum | 2.7% | 4.8% |
| Maximum | 55.8% | 100.0% |
| Range | 53.1% | 95.2% |
| Mean | 17.3% | 23.8% |
| Median | 10.2% | 12.9% |
| Interquartile 25% (IQ1) | 7.0% | 7.5% |
| Interquartile 75% (IQ3) | 27.5% | 33.8% |
| Interquartile Range (IQR) | 20.5% | 26.4% |
| Standard Deviation (Sample) | 14.1% | 24.1% |
| Standard Deviation (Population) | 13.8% | 23.6% |
Demographics Similar to Immigrants from North America and Czechoslovakians by Unemployment Among Ages 30 to 34 years
In terms of unemployment among ages 30 to 34 years, the demographic groups most similar to Immigrants from North America are Lithuanian (5.4%, a difference of 0.020%), Immigrants from Europe (5.4%, a difference of 0.020%), Immigrants from Greece (5.4%, a difference of 0.020%), Serbian (5.4%, a difference of 0.060%), and Russian (5.4%, a difference of 0.090%). Similarly, the demographic groups most similar to Czechoslovakians are Albanian (5.4%, a difference of 0.010%), Immigrants from Belarus (5.4%, a difference of 0.080%), Immigrants from Hungary (5.4%, a difference of 0.18%), South African (5.4%, a difference of 0.21%), and Immigrants from South Eastern Asia (5.4%, a difference of 0.22%).
| Demographics | Rating | Rank | Unemployment Among Ages 30 to 34 years |
| Serbians | 72.9 /100 | #138 | Good 5.4% |
| Lithuanians | 72.4 /100 | #139 | Good 5.4% |
| Immigrants | North America | 72.2 /100 | #140 | Good 5.4% |
| Immigrants | Europe | 72.1 /100 | #141 | Good 5.4% |
| Immigrants | Greece | 72.0 /100 | #142 | Good 5.4% |
| Russians | 71.1 /100 | #143 | Good 5.4% |
| Immigrants | Russia | 71.0 /100 | #144 | Good 5.4% |
| Syrians | 70.3 /100 | #145 | Good 5.4% |
| Celtics | 70.2 /100 | #146 | Good 5.4% |
| Ukrainians | 69.2 /100 | #147 | Good 5.4% |
| Immigrants | Iran | 69.1 /100 | #148 | Good 5.4% |
| Immigrants | Colombia | 68.9 /100 | #149 | Good 5.4% |
| Colombians | 68.7 /100 | #150 | Good 5.4% |
| Immigrants | Oceania | 68.1 /100 | #151 | Good 5.4% |
| Lebanese | 67.2 /100 | #152 | Good 5.4% |
| Immigrants | South Eastern Asia | 66.5 /100 | #153 | Good 5.4% |
| South Africans | 66.5 /100 | #154 | Good 5.4% |
| Immigrants | Hungary | 66.1 /100 | #155 | Good 5.4% |
| Czechoslovakians | 63.7 /100 | #156 | Good 5.4% |
| Albanians | 63.7 /100 | #157 | Good 5.4% |
| Immigrants | Belarus | 62.7 /100 | #158 | Good 5.4% |