Immigrants from Netherlands vs Taiwanese Unemployment Among Ages 35 to 44 years

COMPARE

Immigrants from Netherlands
Race
Ancestry
AfghanAfricanAlaska NativeAlaskan AthabascanAlbanianAleutAlsatianAmericanApacheArabArapahoArgentineanArmenianAssyrian/Chaldean/SyriacAustralianAustrianBahamianBangladeshiBarbadianBasqueBelgianBelizeanBermudanBhutaneseBlackfeetBolivianBrazilianBritishBritish West IndianBulgarianBurmeseCajunCambodianCanadianCape VerdeanCarpatho RusynCelticCentral AmericanCentral American IndianCherokeeCheyenneChickasawChileanChineseChippewaChoctawColombianColvilleComancheCosta RicanCreeCreekCroatianCrowCubanCypriotCzechCzechoslovakianDanishDelawareDominicanDutchDutch West IndianEastern EuropeanEcuadorianEgyptianEnglishEstonianEthiopianEuropeanFijianFilipinoFinnishFrenchFrench American IndianFrench CanadianGermanGerman RussianGhanaianGreekGuamanian/ChamorroGuatemalanGuyaneseHaitianHmongHonduranHopiHoumaHungarianIcelanderIndian (Asian)IndonesianInupiatIranianIraqiIrishIroquoisIsraeliItalianJamaicanJapaneseJordanianKenyanKiowaKoreanLaotianLatvianLebaneseLiberianLithuanianLumbeeLuxembourgerMacedonianMalaysianMalteseMarshalleseMenomineeMexicanMexican American IndianMongolianMoroccanNative HawaiianNavajoNepaleseNew ZealanderNicaraguanNigerianNorthern EuropeanNorwegianOkinawanOsageOttawaPaiutePakistaniPalestinianPanamanianParaguayanPennsylvania GermanPeruvianPimaPolishPortuguesePotawatomiPuebloPuerto RicanPuget Sound SalishRomanianRussianSalvadoranSamoanScandinavianScotch-IrishScottishSeminoleSenegaleseSerbianShoshoneSierra LeoneanSiouxSlavicSlovakSloveneSomaliSouth AfricanSouth AmericanSouth American IndianSoviet UnionSpaniardSpanishSpanish AmericanSpanish American IndianSri LankanSubsaharan AfricanSudaneseSwedishSwissSyrianThaiTlingit-HaidaTohono O'OdhamTonganTrinidadian and TobagonianTsimshianTurkishU.S. Virgin IslanderUgandanUkrainianUruguayanUteVenezuelanVietnameseWelshWest IndianYakamaYaquiYugoslavianYumanYup'ikZimbabwean
Immigration
NonimmigrantsImmigrantsAfghanistanAfricaAlbaniaArgentinaArmeniaAsiaAustraliaAustriaBahamasBangladeshBarbadosBelarusBelgiumBelizeBoliviaBosnia and HerzegovinaBrazilBulgariaBurma/MyanmarCabo VerdeCambodiaCameroonCanadaCaribbeanCentral AmericaChileChinaColombiaCongoCosta RicaCroatiaCubaCzechoslovakiaDenmarkDominicaDominican RepublicEastern AfricaEastern AsiaEastern EuropeEcuadorEgyptEl SalvadorEnglandEritreaEthiopiaEuropeFijiFranceGermanyGhanaGreeceGrenadaGuatemalaGuyanaHaitiHondurasHong KongHungaryIndiaIndonesiaIranIraqIrelandIsraelItalyJamaicaJapanJordanKazakhstanKenyaKoreaKuwaitLaosLatin AmericaLatviaLebanonLiberiaLithuaniaMalaysiaMexicoMicronesiaMiddle AfricaMoldovaMoroccoNepalNetherlandsNicaraguaNigeriaNorth AmericaNorth MacedoniaNorthern AfricaNorthern EuropeNorwayOceaniaPakistanPanamaPeruPhilippinesPolandPortugalRomaniaRussiaSaudi ArabiaScotlandSenegalSerbiaSierra LeoneSingaporeSomaliaSouth AfricaSouth AmericaSouth Central AsiaSouth Eastern AsiaSouthern EuropeSpainSri LankaSt. Vincent and the GrenadinesSudanSwedenSwitzerlandSyriaTaiwanThailandTrinidad and TobagoTurkeyUgandaUkraineUruguayUzbekistanVenezuelaVietnamWest IndiesWestern AfricaWestern AsiaWestern EuropeYemenZaireZimbabweAzores
Taiwanese
Race
Ancestry
AfghanAfricanAlaska NativeAlaskan AthabascanAlbanianAleutAlsatianAmericanApacheArabArapahoArgentineanArmenianAssyrian/Chaldean/SyriacAustralianAustrianBahamianBangladeshiBarbadianBasqueBelgianBelizeanBermudanBhutaneseBlackfeetBolivianBrazilianBritishBritish West IndianBulgarianBurmeseCajunCambodianCanadianCape VerdeanCarpatho RusynCelticCentral AmericanCentral American IndianCherokeeCheyenneChickasawChileanChineseChippewaChoctawColombianColvilleComancheCosta RicanCreeCreekCroatianCrowCubanCypriotCzechCzechoslovakianDanishDelawareDominicanDutchDutch West IndianEastern EuropeanEcuadorianEgyptianEnglishEstonianEthiopianEuropeanFijianFilipinoFinnishFrenchFrench American IndianFrench CanadianGermanGerman RussianGhanaianGreekGuamanian/ChamorroGuatemalanGuyaneseHaitianHmongHonduranHopiHoumaHungarianIcelanderIndian (Asian)IndonesianInupiatIranianIraqiIrishIroquoisIsraeliItalianJamaicanJapaneseJordanianKenyanKiowaKoreanLaotianLatvianLebaneseLiberianLithuanianLumbeeLuxembourgerMacedonianMalaysianMalteseMarshalleseMenomineeMexicanMexican American IndianMongolianMoroccanNative HawaiianNavajoNepaleseNew ZealanderNicaraguanNigerianNorthern EuropeanNorwegianOkinawanOsageOttawaPaiutePakistaniPalestinianPanamanianParaguayanPennsylvania GermanPeruvianPimaPolishPortuguesePotawatomiPuebloPuerto RicanPuget Sound SalishRomanianRussianSalvadoranSamoanScandinavianScotch-IrishScottishSeminoleSenegaleseSerbianShoshoneSierra LeoneanSiouxSlavicSlovakSloveneSomaliSouth AfricanSouth AmericanSouth American IndianSoviet UnionSpaniardSpanishSpanish AmericanSpanish American IndianSri LankanSubsaharan AfricanSudaneseSwedishSwissSyrianTaiwaneseThaiTlingit-HaidaTohono O'OdhamTonganTrinidadian and TobagonianTsimshianTurkishU.S. Virgin IslanderUgandanUkrainianUruguayanUteVenezuelanVietnameseWelshWest IndianYakamaYaquiYugoslavianYumanYup'ikZimbabwean
Immigration
NonimmigrantsImmigrantsAfghanistanAfricaAlbaniaArgentinaArmeniaAsiaAustraliaAustriaBahamasBangladeshBarbadosBelarusBelgiumBelizeBoliviaBosnia and HerzegovinaBrazilBulgariaBurma/MyanmarCabo VerdeCambodiaCameroonCanadaCaribbeanCentral AmericaChileChinaColombiaCongoCosta RicaCroatiaCubaCzechoslovakiaDenmarkDominicaDominican RepublicEastern AfricaEastern AsiaEastern EuropeEcuadorEgyptEl SalvadorEnglandEritreaEthiopiaEuropeFijiFranceGermanyGhanaGreeceGrenadaGuatemalaGuyanaHaitiHondurasHong KongHungaryIndiaIndonesiaIranIraqIrelandIsraelItalyJamaicaJapanJordanKazakhstanKenyaKoreaKuwaitLaosLatin AmericaLatviaLebanonLiberiaLithuaniaMalaysiaMexicoMicronesiaMiddle AfricaMoldovaMoroccoNepalNicaraguaNigeriaNorth AmericaNorth MacedoniaNorthern AfricaNorthern EuropeNorwayOceaniaPakistanPanamaPeruPhilippinesPolandPortugalRomaniaRussiaSaudi ArabiaScotlandSenegalSerbiaSierra LeoneSingaporeSomaliaSouth AfricaSouth AmericaSouth Central AsiaSouth Eastern AsiaSouthern EuropeSpainSri LankaSt. Vincent and the GrenadinesSudanSwedenSwitzerlandSyriaTaiwanThailandTrinidad and TobagoTurkeyUgandaUkraineUruguayUzbekistanVenezuelaVietnamWest IndiesWestern AfricaWestern AsiaWestern EuropeYemenZaireZimbabweAzores
Unemployment Among Ages 35 to 44 years
Income
Poverty
Unemployment
Labor Participation
Family Structure
Vehicle Availability
Education Level
Disability

Unemployment Among Ages 35 to 44 years Comparison

Immigrants from Netherlands

Taiwanese

Exceptional
Exceptional
4.5%
UNEMPLOYMENT AMONG AGES 35 TO 44 YEARS
91.9/ 100
METRIC RATING
101st/ 347
METRIC RANK
4.4%
UNEMPLOYMENT AMONG AGES 35 TO 44 YEARS
97.1/ 100
METRIC RATING
60th/ 347
METRIC RANK

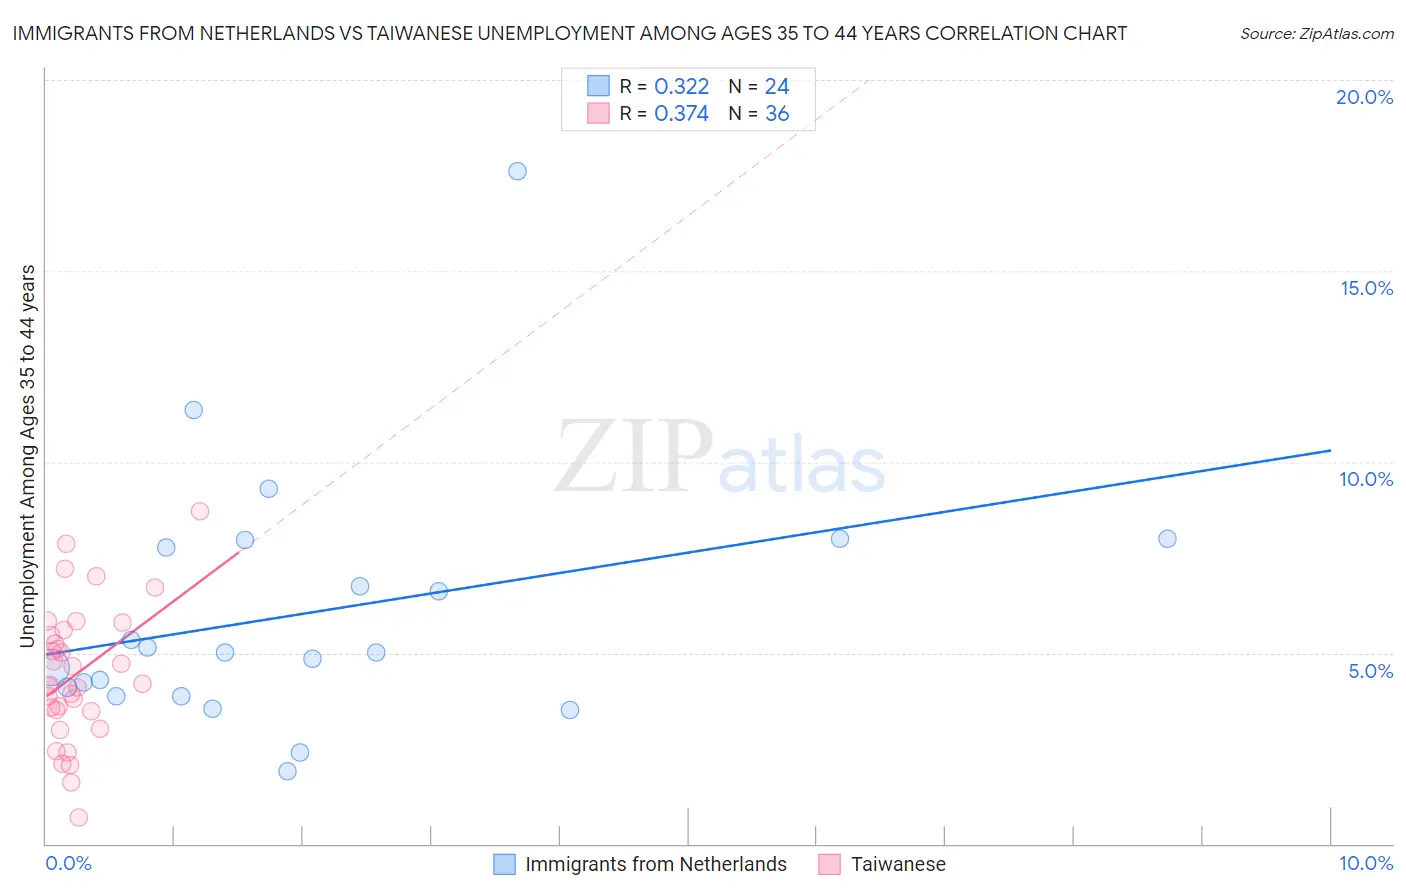
Immigrants from Netherlands vs Taiwanese Unemployment Among Ages 35 to 44 years Correlation Chart

The statistical analysis conducted on geographies consisting of 234,250,164 people shows a mild positive correlation between the proportion of Immigrants from Netherlands and unemployment rate among population between the ages 35 and 44 in the United States with a correlation coefficient (R) of 0.322 and weighted average of 4.5%. Similarly, the statistical analysis conducted on geographies consisting of 31,618,542 people shows a mild positive correlation between the proportion of Taiwanese and unemployment rate among population between the ages 35 and 44 in the United States with a correlation coefficient (R) of 0.374 and weighted average of 4.4%, a difference of 2.1%.
Immigrants from Netherlands vs Taiwanese Unemployment Among Ages 35 to 44 years

Unemployment Among Ages 35 to 44 years Correlation Summary

MeasurementImmigrants from NetherlandsTaiwanese
Minimum1.9%0.70%
Maximum17.6%8.7%
Range15.7%8.0%
Mean6.0%4.4%
Median5.0%4.2%
Interquartile 25% (IQ1)4.0%3.5%
Interquartile 75% (IQ3)7.9%5.5%
Interquartile Range (IQR)3.9%2.0%
Standard Deviation (Sample)3.3%1.8%
Standard Deviation (Population)3.3%1.7%

Similar Demographics by Unemployment Among Ages 35 to 44 years

Demographics Similar to Immigrants from Netherlands by Unemployment Among Ages 35 to 44 years

In terms of unemployment among ages 35 to 44 years, the demographic groups most similar to Immigrants from Netherlands are Italian (4.5%, a difference of 0.010%), Immigrants from Sudan (4.5%, a difference of 0.030%), Welsh (4.5%, a difference of 0.060%), Finnish (4.5%, a difference of 0.070%), and Immigrants from Egypt (4.5%, a difference of 0.10%).
DemographicsRating | RankUnemployment Among Ages 35 to 44 years
Russians
93.8
/100
|
#94
Exceptional
4.5%
Yugoslavians
93.6
/100
|
#95
Exceptional
4.5%
Scottish
93.5
/100
|
#96
Exceptional
4.5%
Immigrants | France
92.5
/100
|
#97
Exceptional
4.5%
Immigrants | Canada
92.3
/100
|
#98
Exceptional
4.5%
Immigrants | Egypt
92.3
/100
|
#99
Exceptional
4.5%
Italians
91.9
/100
|
#100
Exceptional
4.5%
Immigrants | Netherlands
91.9
/100
|
#101
Exceptional
4.5%
Immigrants | Sudan
91.8
/100
|
#102
Exceptional
4.5%
Welsh
91.6
/100
|
#103
Exceptional
4.5%
Finns
91.6
/100
|
#104
Exceptional
4.5%
Immigrants | Saudi Arabia
91.3
/100
|
#105
Exceptional
4.5%
Immigrants | North America
91.1
/100
|
#106
Exceptional
4.5%
Immigrants | North Macedonia
90.7
/100
|
#107
Exceptional
4.5%
New Zealanders
90.3
/100
|
#108
Exceptional
4.5%

Demographics Similar to Taiwanese by Unemployment Among Ages 35 to 44 years

In terms of unemployment among ages 35 to 44 years, the demographic groups most similar to Taiwanese are Croatian (4.4%, a difference of 0.010%), Immigrants from Bulgaria (4.4%, a difference of 0.010%), Austrian (4.4%, a difference of 0.020%), Greek (4.4%, a difference of 0.030%), and English (4.4%, a difference of 0.040%).
DemographicsRating | RankUnemployment Among Ages 35 to 44 years
Immigrants | Argentina
97.6
/100
|
#53
Exceptional
4.4%
Asians
97.4
/100
|
#54
Exceptional
4.4%
Immigrants | Moldova
97.3
/100
|
#55
Exceptional
4.4%
Chileans
97.3
/100
|
#56
Exceptional
4.4%
Immigrants | Hong Kong
97.2
/100
|
#57
Exceptional
4.4%
English
97.2
/100
|
#58
Exceptional
4.4%
Greeks
97.1
/100
|
#59
Exceptional
4.4%
Taiwanese
97.1
/100
|
#60
Exceptional
4.4%
Croatians
97.1
/100
|
#61
Exceptional
4.4%
Immigrants | Bulgaria
97.1
/100
|
#62
Exceptional
4.4%
Austrians
97.1
/100
|
#63
Exceptional
4.4%
Immigrants | Serbia
97.0
/100
|
#64
Exceptional
4.4%
Cambodians
97.0
/100
|
#65
Exceptional
4.4%
Icelanders
96.8
/100
|
#66
Exceptional
4.4%
Argentineans
96.8
/100
|
#67
Exceptional
4.4%