Immigrants from Netherlands vs Taiwanese Female Poverty Among 25-34 Year Olds

COMPARE

Immigrants from Netherlands
Race
Ancestry
AfghanAfricanAlaska NativeAlaskan AthabascanAlbanianAleutAlsatianAmericanApacheArabArapahoArgentineanArmenianAssyrian/Chaldean/SyriacAustralianAustrianBahamianBangladeshiBarbadianBasqueBelgianBelizeanBermudanBhutaneseBlackfeetBolivianBrazilianBritishBritish West IndianBulgarianBurmeseCajunCambodianCanadianCape VerdeanCarpatho RusynCelticCentral AmericanCentral American IndianCherokeeCheyenneChickasawChileanChineseChippewaChoctawColombianColvilleComancheCosta RicanCreeCreekCroatianCrowCubanCypriotCzechCzechoslovakianDanishDelawareDominicanDutchDutch West IndianEastern EuropeanEcuadorianEgyptianEnglishEstonianEthiopianEuropeanFijianFilipinoFinnishFrenchFrench American IndianFrench CanadianGermanGerman RussianGhanaianGreekGuamanian/ChamorroGuatemalanGuyaneseHaitianHmongHonduranHopiHoumaHungarianIcelanderIndian (Asian)IndonesianInupiatIranianIraqiIrishIroquoisIsraeliItalianJamaicanJapaneseJordanianKenyanKiowaKoreanLaotianLatvianLebaneseLiberianLithuanianLumbeeLuxembourgerMacedonianMalaysianMalteseMarshalleseMenomineeMexicanMexican American IndianMongolianMoroccanNative HawaiianNavajoNepaleseNew ZealanderNicaraguanNigerianNorthern EuropeanNorwegianOkinawanOsageOttawaPaiutePakistaniPalestinianPanamanianParaguayanPennsylvania GermanPeruvianPimaPolishPortuguesePotawatomiPuebloPuerto RicanPuget Sound SalishRomanianRussianSalvadoranSamoanScandinavianScotch-IrishScottishSeminoleSenegaleseSerbianShoshoneSierra LeoneanSiouxSlavicSlovakSloveneSomaliSouth AfricanSouth AmericanSouth American IndianSoviet UnionSpaniardSpanishSpanish AmericanSpanish American IndianSri LankanSubsaharan AfricanSudaneseSwedishSwissSyrianThaiTlingit-HaidaTohono O'OdhamTonganTrinidadian and TobagonianTsimshianTurkishU.S. Virgin IslanderUgandanUkrainianUruguayanUteVenezuelanVietnameseWelshWest IndianYakamaYaquiYugoslavianYumanYup'ikZimbabwean
Immigration
NonimmigrantsImmigrantsAfghanistanAfricaAlbaniaArgentinaArmeniaAsiaAustraliaAustriaBahamasBangladeshBarbadosBelarusBelgiumBelizeBoliviaBosnia and HerzegovinaBrazilBulgariaBurma/MyanmarCabo VerdeCambodiaCameroonCanadaCaribbeanCentral AmericaChileChinaColombiaCongoCosta RicaCroatiaCubaCzechoslovakiaDenmarkDominicaDominican RepublicEastern AfricaEastern AsiaEastern EuropeEcuadorEgyptEl SalvadorEnglandEritreaEthiopiaEuropeFijiFranceGermanyGhanaGreeceGrenadaGuatemalaGuyanaHaitiHondurasHong KongHungaryIndiaIndonesiaIranIraqIrelandIsraelItalyJamaicaJapanJordanKazakhstanKenyaKoreaKuwaitLaosLatin AmericaLatviaLebanonLiberiaLithuaniaMalaysiaMexicoMicronesiaMiddle AfricaMoldovaMoroccoNepalNetherlandsNicaraguaNigeriaNorth AmericaNorth MacedoniaNorthern AfricaNorthern EuropeNorwayOceaniaPakistanPanamaPeruPhilippinesPolandPortugalRomaniaRussiaSaudi ArabiaScotlandSenegalSerbiaSierra LeoneSingaporeSomaliaSouth AfricaSouth AmericaSouth Central AsiaSouth Eastern AsiaSouthern EuropeSpainSri LankaSt. Vincent and the GrenadinesSudanSwedenSwitzerlandSyriaTaiwanThailandTrinidad and TobagoTurkeyUgandaUkraineUruguayUzbekistanVenezuelaVietnamWest IndiesWestern AfricaWestern AsiaWestern EuropeYemenZaireZimbabweAzores
Taiwanese
Race
Ancestry
AfghanAfricanAlaska NativeAlaskan AthabascanAlbanianAleutAlsatianAmericanApacheArabArapahoArgentineanArmenianAssyrian/Chaldean/SyriacAustralianAustrianBahamianBangladeshiBarbadianBasqueBelgianBelizeanBermudanBhutaneseBlackfeetBolivianBrazilianBritishBritish West IndianBulgarianBurmeseCajunCambodianCanadianCape VerdeanCarpatho RusynCelticCentral AmericanCentral American IndianCherokeeCheyenneChickasawChileanChineseChippewaChoctawColombianColvilleComancheCosta RicanCreeCreekCroatianCrowCubanCypriotCzechCzechoslovakianDanishDelawareDominicanDutchDutch West IndianEastern EuropeanEcuadorianEgyptianEnglishEstonianEthiopianEuropeanFijianFilipinoFinnishFrenchFrench American IndianFrench CanadianGermanGerman RussianGhanaianGreekGuamanian/ChamorroGuatemalanGuyaneseHaitianHmongHonduranHopiHoumaHungarianIcelanderIndian (Asian)IndonesianInupiatIranianIraqiIrishIroquoisIsraeliItalianJamaicanJapaneseJordanianKenyanKiowaKoreanLaotianLatvianLebaneseLiberianLithuanianLumbeeLuxembourgerMacedonianMalaysianMalteseMarshalleseMenomineeMexicanMexican American IndianMongolianMoroccanNative HawaiianNavajoNepaleseNew ZealanderNicaraguanNigerianNorthern EuropeanNorwegianOkinawanOsageOttawaPaiutePakistaniPalestinianPanamanianParaguayanPennsylvania GermanPeruvianPimaPolishPortuguesePotawatomiPuebloPuerto RicanPuget Sound SalishRomanianRussianSalvadoranSamoanScandinavianScotch-IrishScottishSeminoleSenegaleseSerbianShoshoneSierra LeoneanSiouxSlavicSlovakSloveneSomaliSouth AfricanSouth AmericanSouth American IndianSoviet UnionSpaniardSpanishSpanish AmericanSpanish American IndianSri LankanSubsaharan AfricanSudaneseSwedishSwissSyrianTaiwaneseThaiTlingit-HaidaTohono O'OdhamTonganTrinidadian and TobagonianTsimshianTurkishU.S. Virgin IslanderUgandanUkrainianUruguayanUteVenezuelanVietnameseWelshWest IndianYakamaYaquiYugoslavianYumanYup'ikZimbabwean
Immigration
NonimmigrantsImmigrantsAfghanistanAfricaAlbaniaArgentinaArmeniaAsiaAustraliaAustriaBahamasBangladeshBarbadosBelarusBelgiumBelizeBoliviaBosnia and HerzegovinaBrazilBulgariaBurma/MyanmarCabo VerdeCambodiaCameroonCanadaCaribbeanCentral AmericaChileChinaColombiaCongoCosta RicaCroatiaCubaCzechoslovakiaDenmarkDominicaDominican RepublicEastern AfricaEastern AsiaEastern EuropeEcuadorEgyptEl SalvadorEnglandEritreaEthiopiaEuropeFijiFranceGermanyGhanaGreeceGrenadaGuatemalaGuyanaHaitiHondurasHong KongHungaryIndiaIndonesiaIranIraqIrelandIsraelItalyJamaicaJapanJordanKazakhstanKenyaKoreaKuwaitLaosLatin AmericaLatviaLebanonLiberiaLithuaniaMalaysiaMexicoMicronesiaMiddle AfricaMoldovaMoroccoNepalNicaraguaNigeriaNorth AmericaNorth MacedoniaNorthern AfricaNorthern EuropeNorwayOceaniaPakistanPanamaPeruPhilippinesPolandPortugalRomaniaRussiaSaudi ArabiaScotlandSenegalSerbiaSierra LeoneSingaporeSomaliaSouth AfricaSouth AmericaSouth Central AsiaSouth Eastern AsiaSouthern EuropeSpainSri LankaSt. Vincent and the GrenadinesSudanSwedenSwitzerlandSyriaTaiwanThailandTrinidad and TobagoTurkeyUgandaUkraineUruguayUzbekistanVenezuelaVietnamWest IndiesWestern AfricaWestern AsiaWestern EuropeYemenZaireZimbabweAzores
Female Poverty Among 25-34 Year Olds
Income
Poverty
Unemployment
Labor Participation
Family Structure
Vehicle Availability
Education Level
Disability

Female Poverty Among 25-34 Year Olds Comparison

Immigrants from Netherlands

Taiwanese

Exceptional
Exceptional
12.8%
FEMALE POVERTY AMONG 25-34 YEAR OLDS
92.0/ 100
METRIC RATING
124th/ 347
METRIC RANK
11.8%
FEMALE POVERTY AMONG 25-34 YEAR OLDS
99.8/ 100
METRIC RATING
37th/ 347
METRIC RANK

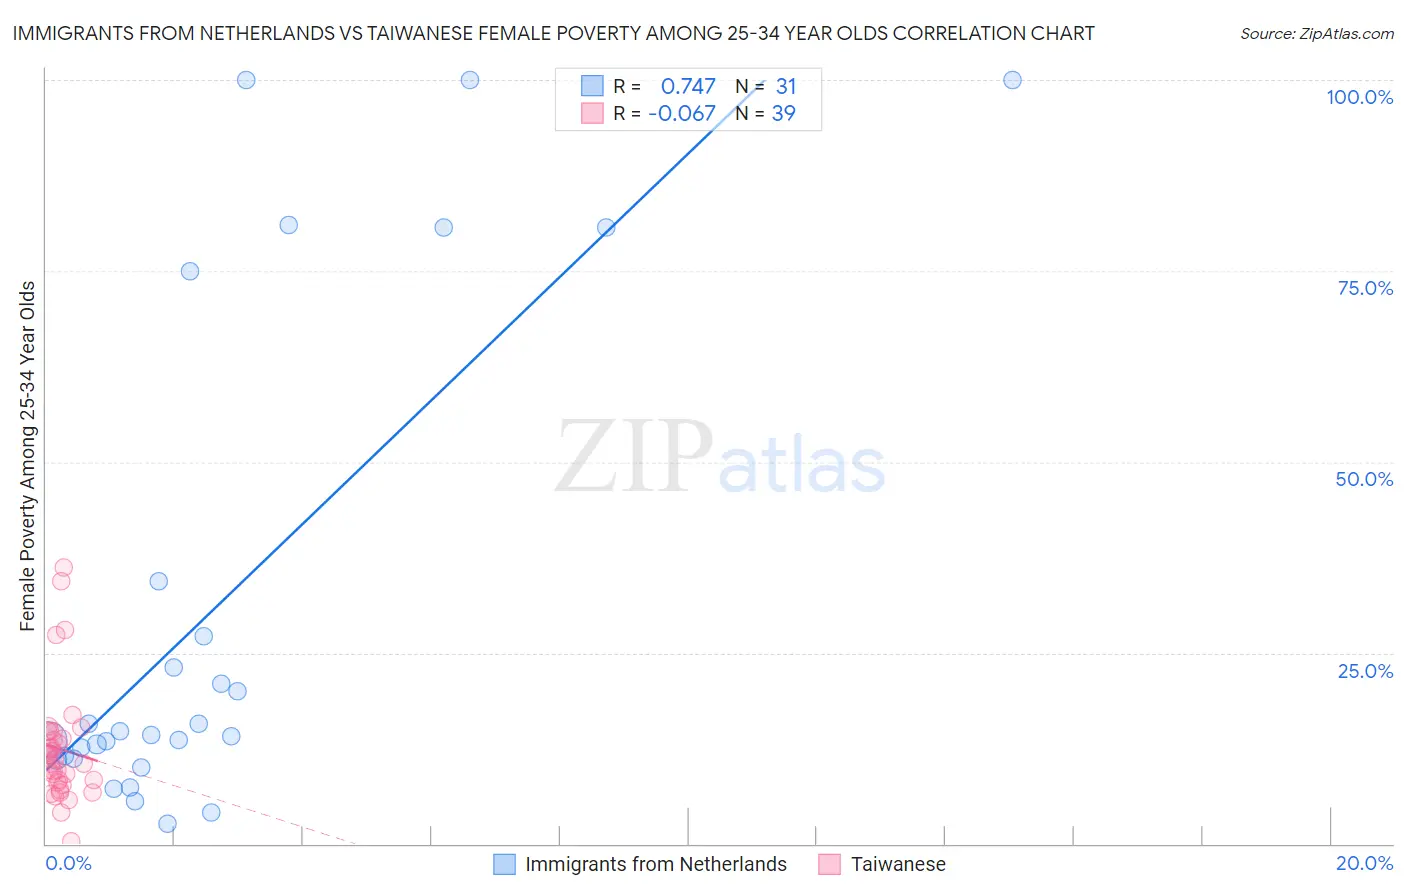
Immigrants from Netherlands vs Taiwanese Female Poverty Among 25-34 Year Olds Correlation Chart

The statistical analysis conducted on geographies consisting of 234,780,200 people shows a strong positive correlation between the proportion of Immigrants from Netherlands and poverty level among females between the ages 25 and 34 in the United States with a correlation coefficient (R) of 0.747 and weighted average of 12.8%. Similarly, the statistical analysis conducted on geographies consisting of 31,656,298 people shows a slight negative correlation between the proportion of Taiwanese and poverty level among females between the ages 25 and 34 in the United States with a correlation coefficient (R) of -0.067 and weighted average of 11.8%, a difference of 9.1%.
Immigrants from Netherlands vs Taiwanese Female Poverty Among 25-34 Year Olds

Female Poverty Among 25-34 Year Olds Correlation Summary

MeasurementImmigrants from NetherlandsTaiwanese
Minimum2.7%0.25%
Maximum100.0%36.2%
Range97.3%36.0%
Mean30.8%12.4%
Median14.2%11.2%
Interquartile 25% (IQ1)11.1%8.0%
Interquartile 75% (IQ3)34.4%14.7%
Interquartile Range (IQR)23.3%6.7%
Standard Deviation (Sample)32.5%7.5%
Standard Deviation (Population)32.0%7.4%

Similar Demographics by Female Poverty Among 25-34 Year Olds

Demographics Similar to Immigrants from Netherlands by Female Poverty Among 25-34 Year Olds

In terms of female poverty among 25-34 year olds, the demographic groups most similar to Immigrants from Netherlands are Immigrants from Canada (12.9%, a difference of 0.15%), Slovene (12.8%, a difference of 0.22%), Immigrants from Fiji (12.9%, a difference of 0.23%), Immigrants from Western Asia (12.8%, a difference of 0.24%), and Romanian (12.8%, a difference of 0.26%).
DemographicsRating | RankFemale Poverty Among 25-34 Year Olds
Immigrants | Kuwait
93.1
/100
|
#117
Exceptional
12.8%
Mongolians
93.0
/100
|
#118
Exceptional
12.8%
Immigrants | Nepal
93.0
/100
|
#119
Exceptional
12.8%
Carpatho Rusyns
93.0
/100
|
#120
Exceptional
12.8%
Romanians
92.8
/100
|
#121
Exceptional
12.8%
Immigrants | Western Asia
92.7
/100
|
#122
Exceptional
12.8%
Slovenes
92.7
/100
|
#123
Exceptional
12.8%
Immigrants | Netherlands
92.0
/100
|
#124
Exceptional
12.8%
Immigrants | Canada
91.5
/100
|
#125
Exceptional
12.9%
Immigrants | Fiji
91.2
/100
|
#126
Exceptional
12.9%
Czechs
90.3
/100
|
#127
Exceptional
12.9%
Syrians
90.2
/100
|
#128
Exceptional
12.9%
Immigrants | North America
89.7
/100
|
#129
Excellent
12.9%
Immigrants | Uzbekistan
89.6
/100
|
#130
Excellent
12.9%
Pakistanis
88.4
/100
|
#131
Excellent
13.0%

Demographics Similar to Taiwanese by Female Poverty Among 25-34 Year Olds

In terms of female poverty among 25-34 year olds, the demographic groups most similar to Taiwanese are Immigrants from North Macedonia (11.8%, a difference of 0.070%), Immigrants from Sri Lanka (11.8%, a difference of 0.16%), Latvian (11.8%, a difference of 0.32%), Immigrants from Bulgaria (11.8%, a difference of 0.48%), and Immigrants from Indonesia (11.8%, a difference of 0.61%).
DemographicsRating | RankFemale Poverty Among 25-34 Year Olds
Cypriots
99.9
/100
|
#30
Exceptional
11.5%
Immigrants | Japan
99.9
/100
|
#31
Exceptional
11.6%
Immigrants | Asia
99.9
/100
|
#32
Exceptional
11.6%
Immigrants | Poland
99.9
/100
|
#33
Exceptional
11.6%
Zimbabweans
99.9
/100
|
#34
Exceptional
11.7%
Cambodians
99.9
/100
|
#35
Exceptional
11.7%
Immigrants | Sri Lanka
99.8
/100
|
#36
Exceptional
11.8%
Taiwanese
99.8
/100
|
#37
Exceptional
11.8%
Immigrants | North Macedonia
99.8
/100
|
#38
Exceptional
11.8%
Latvians
99.8
/100
|
#39
Exceptional
11.8%
Immigrants | Bulgaria
99.8
/100
|
#40
Exceptional
11.8%
Immigrants | Indonesia
99.8
/100
|
#41
Exceptional
11.8%
Immigrants | Turkey
99.7
/100
|
#42
Exceptional
11.9%
Egyptians
99.7
/100
|
#43
Exceptional
11.9%
Immigrants | Australia
99.7
/100
|
#44
Exceptional
11.9%