Immigrants from Micronesia vs Immigrants from Somalia Unemployment
COMPARE
Immigrants from Micronesia
Immigrants from Somalia
Unemployment
Unemployment Comparison
Immigrants from Micronesia
Immigrants from Somalia
5.3%
UNEMPLOYMENT
25.2/ 100
METRIC RATING
203rd/ 347
METRIC RANK
5.3%
UNEMPLOYMENT
33.8/ 100
METRIC RATING
193rd/ 347
METRIC RANK
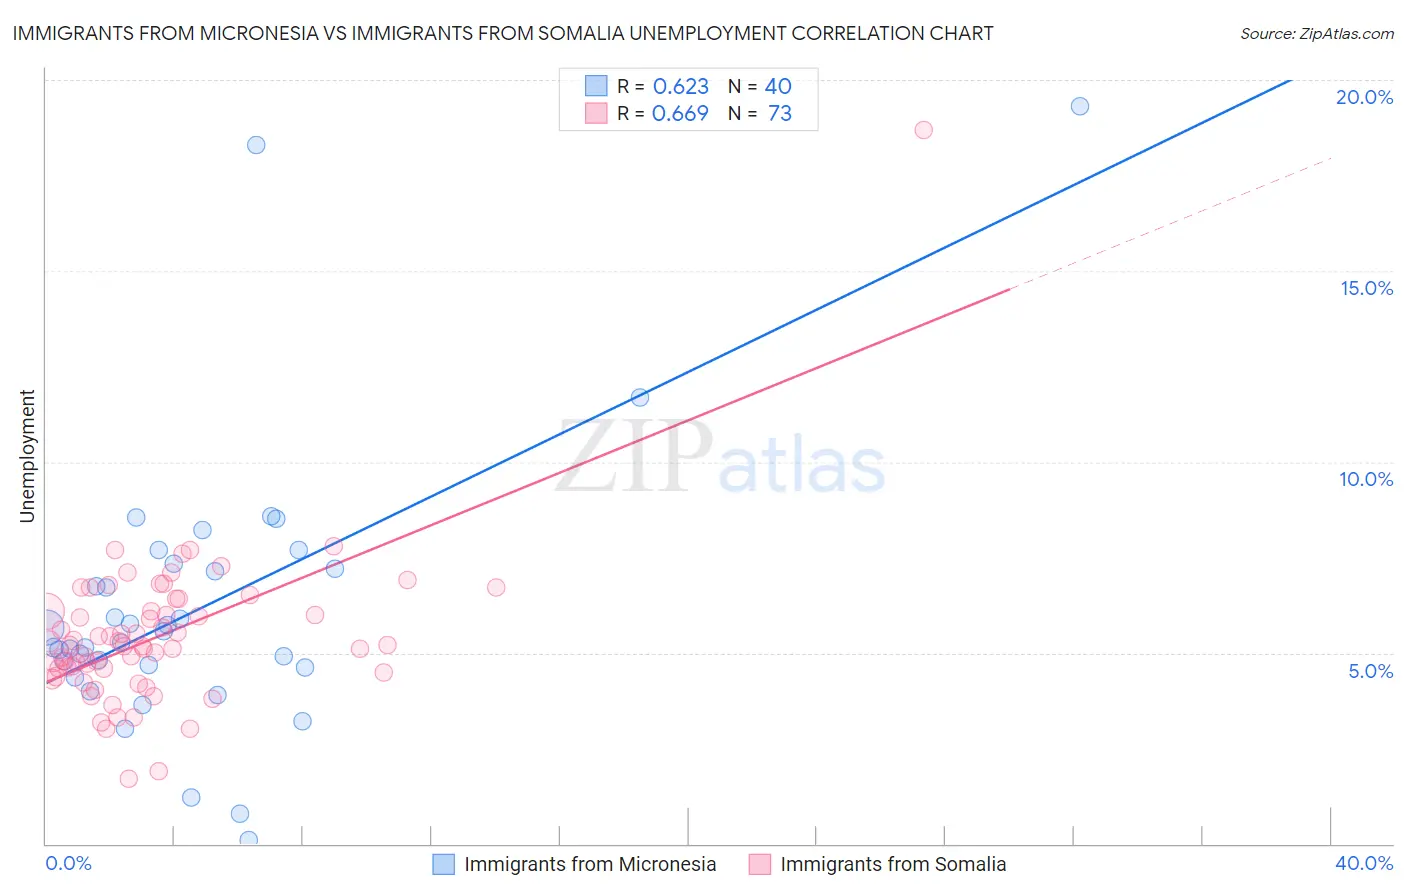
Immigrants from Micronesia vs Immigrants from Somalia Unemployment Correlation Chart
The statistical analysis conducted on geographies consisting of 61,596,499 people shows a significant positive correlation between the proportion of Immigrants from Micronesia and unemployment in the United States with a correlation coefficient (R) of 0.623 and weighted average of 5.3%. Similarly, the statistical analysis conducted on geographies consisting of 92,091,323 people shows a significant positive correlation between the proportion of Immigrants from Somalia and unemployment in the United States with a correlation coefficient (R) of 0.669 and weighted average of 5.3%, a difference of 0.63%.
Unemployment Correlation Summary
| Measurement | Immigrants from Micronesia | Immigrants from Somalia |
| Minimum | 0.10% | 1.7% |
| Maximum | 19.3% | 18.7% |
| Range | 19.2% | 17.0% |
| Mean | 6.2% | 5.4% |
| Median | 5.4% | 5.2% |
| Interquartile 25% (IQ1) | 4.6% | 4.5% |
| Interquartile 75% (IQ3) | 7.3% | 6.2% |
| Interquartile Range (IQR) | 2.6% | 1.7% |
| Standard Deviation (Sample) | 3.7% | 2.1% |
| Standard Deviation (Population) | 3.6% | 2.0% |
Demographics Similar to Immigrants from Micronesia and Immigrants from Somalia by Unemployment
In terms of unemployment, the demographic groups most similar to Immigrants from Micronesia are Cherokee (5.3%, a difference of 0.030%), Immigrants from Ukraine (5.3%, a difference of 0.030%), Native Hawaiian (5.3%, a difference of 0.080%), Immigrants from South Eastern Asia (5.3%, a difference of 0.14%), and Korean (5.3%, a difference of 0.17%). Similarly, the demographic groups most similar to Immigrants from Somalia are Somali (5.3%, a difference of 0.010%), South American (5.3%, a difference of 0.010%), Arab (5.3%, a difference of 0.10%), Immigrants from Belarus (5.3%, a difference of 0.12%), and Immigrants from Laos (5.3%, a difference of 0.20%).
| Demographics | Rating | Rank | Unemployment |
| Alsatians | 37.0 /100 | #188 | Fair 5.3% |
| Immigrants | Belarus | 35.6 /100 | #189 | Fair 5.3% |
| Arabs | 35.3 /100 | #190 | Fair 5.3% |
| Somalis | 34.0 /100 | #191 | Fair 5.3% |
| South Americans | 33.9 /100 | #192 | Fair 5.3% |
| Immigrants | Somalia | 33.8 /100 | #193 | Fair 5.3% |
| Immigrants | Laos | 30.9 /100 | #194 | Fair 5.3% |
| Immigrants | Southern Europe | 30.9 /100 | #195 | Fair 5.3% |
| Peruvians | 29.9 /100 | #196 | Fair 5.3% |
| Immigrants | Uruguay | 29.8 /100 | #197 | Fair 5.3% |
| Immigrants | Israel | 28.6 /100 | #198 | Fair 5.3% |
| Immigrants | Afghanistan | 28.6 /100 | #199 | Fair 5.3% |
| Koreans | 27.4 /100 | #200 | Fair 5.3% |
| Immigrants | South Eastern Asia | 27.0 /100 | #201 | Fair 5.3% |
| Cherokee | 25.5 /100 | #202 | Fair 5.3% |
| Immigrants | Micronesia | 25.2 /100 | #203 | Fair 5.3% |
| Immigrants | Ukraine | 24.9 /100 | #204 | Fair 5.3% |
| Native Hawaiians | 24.1 /100 | #205 | Fair 5.3% |
| Immigrants | Peru | 22.7 /100 | #206 | Fair 5.4% |
| Creek | 19.4 /100 | #207 | Poor 5.4% |
| Portuguese | 19.0 /100 | #208 | Poor 5.4% |