Immigrants from Czechoslovakia vs Immigrants from Somalia Unemployment
COMPARE
Immigrants from Czechoslovakia
Immigrants from Somalia
Unemployment
Unemployment Comparison
Immigrants from Czechoslovakia
Immigrants from Somalia
5.0%
UNEMPLOYMENT
95.1/ 100
METRIC RATING
97th/ 347
METRIC RANK
5.3%
UNEMPLOYMENT
33.8/ 100
METRIC RATING
193rd/ 347
METRIC RANK
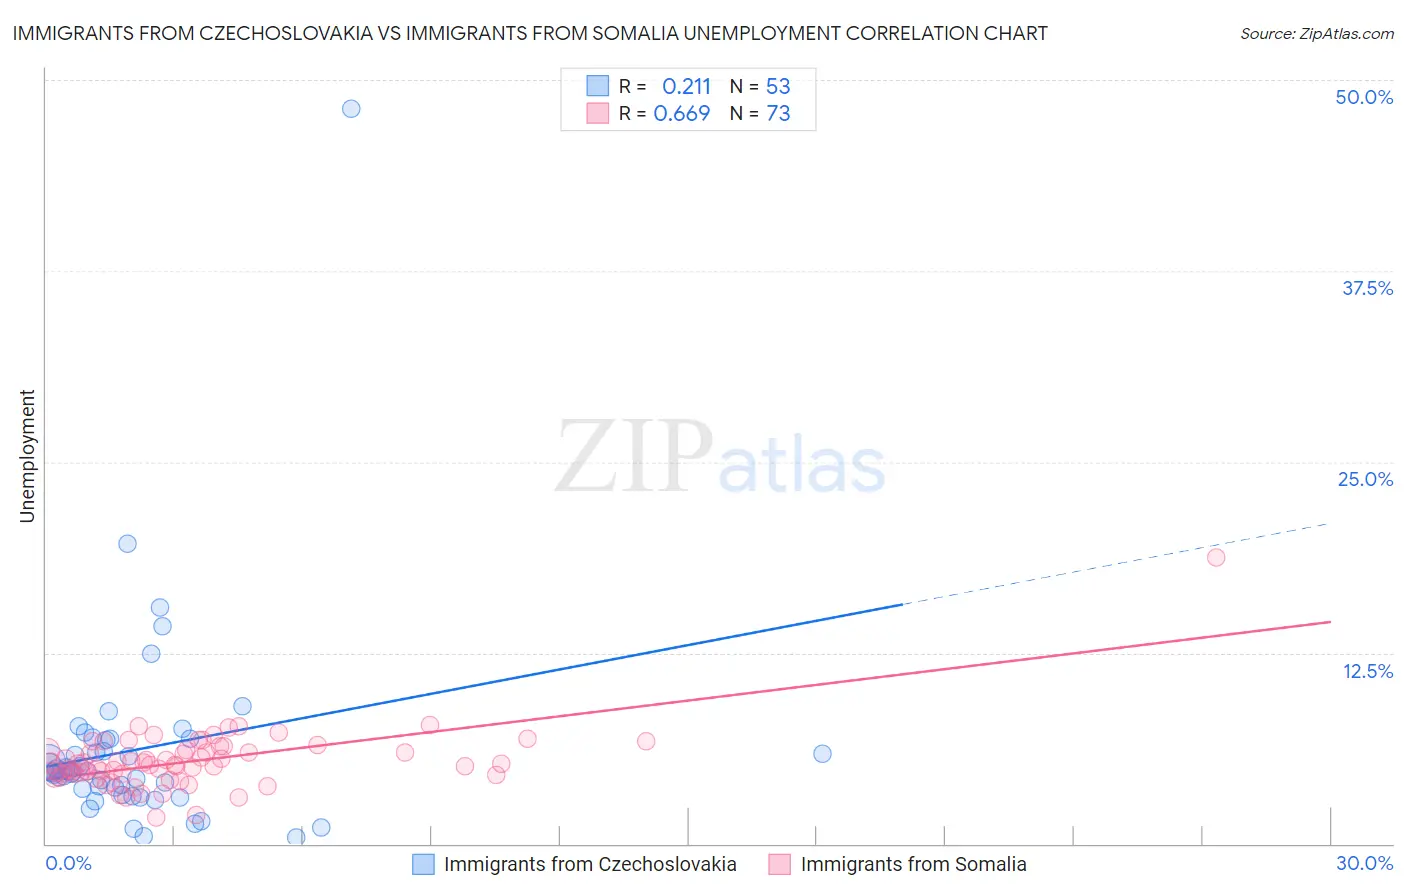
Immigrants from Czechoslovakia vs Immigrants from Somalia Unemployment Correlation Chart
The statistical analysis conducted on geographies consisting of 195,397,412 people shows a weak positive correlation between the proportion of Immigrants from Czechoslovakia and unemployment in the United States with a correlation coefficient (R) of 0.211 and weighted average of 5.0%. Similarly, the statistical analysis conducted on geographies consisting of 92,091,323 people shows a significant positive correlation between the proportion of Immigrants from Somalia and unemployment in the United States with a correlation coefficient (R) of 0.669 and weighted average of 5.3%, a difference of 5.9%.
Unemployment Correlation Summary
| Measurement | Immigrants from Czechoslovakia | Immigrants from Somalia |
| Minimum | 0.40% | 1.7% |
| Maximum | 48.1% | 18.7% |
| Range | 47.7% | 17.0% |
| Mean | 6.2% | 5.4% |
| Median | 4.7% | 5.2% |
| Interquartile 25% (IQ1) | 3.4% | 4.5% |
| Interquartile 75% (IQ3) | 6.9% | 6.2% |
| Interquartile Range (IQR) | 3.5% | 1.7% |
| Standard Deviation (Sample) | 6.9% | 2.1% |
| Standard Deviation (Population) | 6.8% | 2.0% |
Similar Demographics by Unemployment
Demographics Similar to Immigrants from Czechoslovakia by Unemployment
In terms of unemployment, the demographic groups most similar to Immigrants from Czechoslovakia are Immigrants from England (5.0%, a difference of 0.030%), Romanian (5.0%, a difference of 0.030%), Mongolian (5.0%, a difference of 0.10%), Estonian (5.0%, a difference of 0.16%), and Immigrants from Serbia (5.0%, a difference of 0.19%).
| Demographics | Rating | Rank | Unemployment |
| Immigrants | North Macedonia | 96.3 /100 | #90 | Exceptional 5.0% |
| Immigrants | Sudan | 96.3 /100 | #91 | Exceptional 5.0% |
| Immigrants | South Africa | 96.2 /100 | #92 | Exceptional 5.0% |
| Ukrainians | 96.0 /100 | #93 | Exceptional 5.0% |
| Immigrants | Austria | 95.9 /100 | #94 | Exceptional 5.0% |
| Immigrants | Serbia | 95.6 /100 | #95 | Exceptional 5.0% |
| Immigrants | England | 95.2 /100 | #96 | Exceptional 5.0% |
| Immigrants | Czechoslovakia | 95.1 /100 | #97 | Exceptional 5.0% |
| Romanians | 95.0 /100 | #98 | Exceptional 5.0% |
| Mongolians | 94.8 /100 | #99 | Exceptional 5.0% |
| Estonians | 94.6 /100 | #100 | Exceptional 5.0% |
| Americans | 94.3 /100 | #101 | Exceptional 5.0% |
| Immigrants | Argentina | 94.1 /100 | #102 | Exceptional 5.0% |
| Chickasaw | 94.0 /100 | #103 | Exceptional 5.0% |
| Osage | 94.0 /100 | #104 | Exceptional 5.0% |
Demographics Similar to Immigrants from Somalia by Unemployment
In terms of unemployment, the demographic groups most similar to Immigrants from Somalia are Somali (5.3%, a difference of 0.010%), South American (5.3%, a difference of 0.010%), Arab (5.3%, a difference of 0.10%), Immigrants from Belarus (5.3%, a difference of 0.12%), and Immigrants from Laos (5.3%, a difference of 0.20%).
| Demographics | Rating | Rank | Unemployment |
| Immigrants | Uganda | 37.8 /100 | #186 | Fair 5.3% |
| Costa Ricans | 37.4 /100 | #187 | Fair 5.3% |
| Alsatians | 37.0 /100 | #188 | Fair 5.3% |
| Immigrants | Belarus | 35.6 /100 | #189 | Fair 5.3% |
| Arabs | 35.3 /100 | #190 | Fair 5.3% |
| Somalis | 34.0 /100 | #191 | Fair 5.3% |
| South Americans | 33.9 /100 | #192 | Fair 5.3% |
| Immigrants | Somalia | 33.8 /100 | #193 | Fair 5.3% |
| Immigrants | Laos | 30.9 /100 | #194 | Fair 5.3% |
| Immigrants | Southern Europe | 30.9 /100 | #195 | Fair 5.3% |
| Peruvians | 29.9 /100 | #196 | Fair 5.3% |
| Immigrants | Uruguay | 29.8 /100 | #197 | Fair 5.3% |
| Immigrants | Israel | 28.6 /100 | #198 | Fair 5.3% |
| Immigrants | Afghanistan | 28.6 /100 | #199 | Fair 5.3% |
| Koreans | 27.4 /100 | #200 | Fair 5.3% |