Immigrants from Mexico vs French Unemployment Among Ages 65 to 74 years

COMPARE

Immigrants from Mexico
Race
Ancestry
AfghanAfricanAlaska NativeAlaskan AthabascanAlbanianAleutAlsatianAmericanApacheArabArapahoArgentineanArmenianAssyrian/Chaldean/SyriacAustralianAustrianBahamianBangladeshiBarbadianBasqueBelgianBelizeanBermudanBhutaneseBlackfeetBolivianBrazilianBritishBritish West IndianBulgarianBurmeseCajunCambodianCanadianCape VerdeanCarpatho RusynCelticCentral AmericanCentral American IndianCherokeeCheyenneChickasawChileanChineseChippewaChoctawColombianColvilleComancheCosta RicanCreeCreekCroatianCrowCubanCypriotCzechCzechoslovakianDanishDelawareDominicanDutchDutch West IndianEastern EuropeanEcuadorianEgyptianEnglishEstonianEthiopianEuropeanFijianFilipinoFinnishFrench American IndianFrench CanadianGermanGerman RussianGhanaianGreekGuamanian/ChamorroGuatemalanGuyaneseHaitianHmongHonduranHopiHoumaHungarianIcelanderIndian (Asian)IndonesianInupiatIranianIraqiIrishIroquoisIsraeliItalianJamaicanJapaneseJordanianKenyanKiowaKoreanLaotianLatvianLebaneseLiberianLithuanianLumbeeLuxembourgerMacedonianMalaysianMalteseMarshalleseMenomineeMexicanMexican American IndianMongolianMoroccanNative HawaiianNavajoNepaleseNew ZealanderNicaraguanNigerianNorthern EuropeanNorwegianOkinawanOsageOttawaPaiutePakistaniPalestinianPanamanianParaguayanPennsylvania GermanPeruvianPimaPolishPortuguesePotawatomiPuebloPuerto RicanPuget Sound SalishRomanianRussianSalvadoranSamoanScandinavianScotch-IrishScottishSeminoleSenegaleseSerbianShoshoneSierra LeoneanSiouxSlavicSlovakSloveneSomaliSouth AfricanSouth AmericanSouth American IndianSoviet UnionSpaniardSpanishSpanish AmericanSpanish American IndianSri LankanSubsaharan AfricanSudaneseSwedishSwissSyrianTaiwaneseThaiTlingit-HaidaTohono O'OdhamTonganTrinidadian and TobagonianTsimshianTurkishU.S. Virgin IslanderUgandanUkrainianUruguayanUteVenezuelanVietnameseWelshWest IndianYakamaYaquiYugoslavianYumanYup'ikZimbabwean
Immigration
NonimmigrantsImmigrantsAfghanistanAfricaAlbaniaArgentinaArmeniaAsiaAustraliaAustriaBahamasBangladeshBarbadosBelarusBelgiumBelizeBoliviaBosnia and HerzegovinaBrazilBulgariaBurma/MyanmarCabo VerdeCambodiaCameroonCanadaCaribbeanCentral AmericaChileChinaColombiaCongoCosta RicaCroatiaCubaCzechoslovakiaDenmarkDominicaDominican RepublicEastern AfricaEastern AsiaEastern EuropeEcuadorEgyptEl SalvadorEnglandEritreaEthiopiaEuropeFijiFranceGermanyGhanaGreeceGrenadaGuatemalaGuyanaHaitiHondurasHong KongHungaryIndiaIndonesiaIranIraqIrelandIsraelItalyJamaicaJapanJordanKazakhstanKenyaKoreaKuwaitLaosLatin AmericaLatviaLebanonLiberiaLithuaniaMalaysiaMexicoMicronesiaMiddle AfricaMoldovaMoroccoNepalNetherlandsNicaraguaNigeriaNorth AmericaNorth MacedoniaNorthern AfricaNorthern EuropeNorwayOceaniaPakistanPanamaPeruPhilippinesPolandPortugalRomaniaRussiaSaudi ArabiaScotlandSenegalSerbiaSierra LeoneSingaporeSomaliaSouth AfricaSouth AmericaSouth Central AsiaSouth Eastern AsiaSouthern EuropeSpainSri LankaSt. Vincent and the GrenadinesSudanSwedenSwitzerlandSyriaTaiwanThailandTrinidad and TobagoTurkeyUgandaUkraineUruguayUzbekistanVenezuelaVietnamWest IndiesWestern AfricaWestern AsiaWestern EuropeYemenZaireZimbabweAzores
French
Race
Ancestry
AfghanAfricanAlaska NativeAlaskan AthabascanAlbanianAleutAlsatianAmericanApacheArabArapahoArgentineanArmenianAssyrian/Chaldean/SyriacAustralianAustrianBahamianBangladeshiBarbadianBasqueBelgianBelizeanBermudanBhutaneseBlackfeetBolivianBrazilianBritishBritish West IndianBulgarianBurmeseCajunCambodianCanadianCape VerdeanCarpatho RusynCelticCentral AmericanCentral American IndianCherokeeCheyenneChickasawChileanChineseChippewaChoctawColombianColvilleComancheCosta RicanCreeCreekCroatianCrowCubanCypriotCzechCzechoslovakianDanishDelawareDominicanDutchDutch West IndianEastern EuropeanEcuadorianEgyptianEnglishEstonianEthiopianEuropeanFijianFilipinoFinnishFrenchFrench American IndianFrench CanadianGermanGerman RussianGhanaianGreekGuamanian/ChamorroGuatemalanGuyaneseHaitianHmongHonduranHopiHoumaHungarianIcelanderIndian (Asian)IndonesianInupiatIranianIraqiIrishIroquoisIsraeliItalianJamaicanJapaneseJordanianKenyanKiowaKoreanLaotianLatvianLebaneseLiberianLithuanianLumbeeLuxembourgerMacedonianMalaysianMalteseMarshalleseMenomineeMexicanMexican American IndianMongolianMoroccanNative HawaiianNavajoNepaleseNew ZealanderNicaraguanNigerianNorthern EuropeanNorwegianOkinawanOsageOttawaPaiutePakistaniPalestinianPanamanianParaguayanPennsylvania GermanPeruvianPimaPolishPortuguesePotawatomiPuebloPuerto RicanPuget Sound SalishRomanianRussianSalvadoranSamoanScandinavianScotch-IrishScottishSeminoleSenegaleseSerbianShoshoneSierra LeoneanSiouxSlavicSlovakSloveneSomaliSouth AfricanSouth AmericanSouth American IndianSoviet UnionSpaniardSpanishSpanish AmericanSpanish American IndianSri LankanSubsaharan AfricanSudaneseSwedishSwissSyrianTaiwaneseThaiTlingit-HaidaTohono O'OdhamTonganTrinidadian and TobagonianTsimshianTurkishU.S. Virgin IslanderUgandanUkrainianUruguayanUteVenezuelanVietnameseWelshWest IndianYakamaYaquiYugoslavianYumanYup'ikZimbabwean
Immigration
NonimmigrantsImmigrantsAfghanistanAfricaAlbaniaArgentinaArmeniaAsiaAustraliaAustriaBahamasBangladeshBarbadosBelarusBelgiumBelizeBoliviaBosnia and HerzegovinaBrazilBulgariaBurma/MyanmarCabo VerdeCambodiaCameroonCanadaCaribbeanCentral AmericaChileChinaColombiaCongoCosta RicaCroatiaCubaCzechoslovakiaDenmarkDominicaDominican RepublicEastern AfricaEastern AsiaEastern EuropeEcuadorEgyptEl SalvadorEnglandEritreaEthiopiaEuropeFijiFranceGermanyGhanaGreeceGrenadaGuatemalaGuyanaHaitiHondurasHong KongHungaryIndiaIndonesiaIranIraqIrelandIsraelItalyJamaicaJapanJordanKazakhstanKenyaKoreaKuwaitLaosLatin AmericaLatviaLebanonLiberiaLithuaniaMalaysiaMicronesiaMiddle AfricaMoldovaMoroccoNepalNetherlandsNicaraguaNigeriaNorth AmericaNorth MacedoniaNorthern AfricaNorthern EuropeNorwayOceaniaPakistanPanamaPeruPhilippinesPolandPortugalRomaniaRussiaSaudi ArabiaScotlandSenegalSerbiaSierra LeoneSingaporeSomaliaSouth AfricaSouth AmericaSouth Central AsiaSouth Eastern AsiaSouthern EuropeSpainSri LankaSt. Vincent and the GrenadinesSudanSwedenSwitzerlandSyriaTaiwanThailandTrinidad and TobagoTurkeyUgandaUkraineUruguayUzbekistanVenezuelaVietnamWest IndiesWestern AfricaWestern AsiaWestern EuropeYemenZaireZimbabweAzores
Unemployment Among Ages 65 to 74 years
Income
Poverty
Unemployment
Labor Participation
Family Structure
Vehicle Availability
Education Level
Disability

Unemployment Among Ages 65 to 74 years Comparison

Immigrants from Mexico

French

Tragic
Average
6.0%
UNEMPLOYMENT AMONG AGES 65 TO 74 YEARS
0.0/ 100
METRIC RATING
322nd/ 347
METRIC RANK
5.4%
UNEMPLOYMENT AMONG AGES 65 TO 74 YEARS
43.1/ 100
METRIC RATING
178th/ 347
METRIC RANK

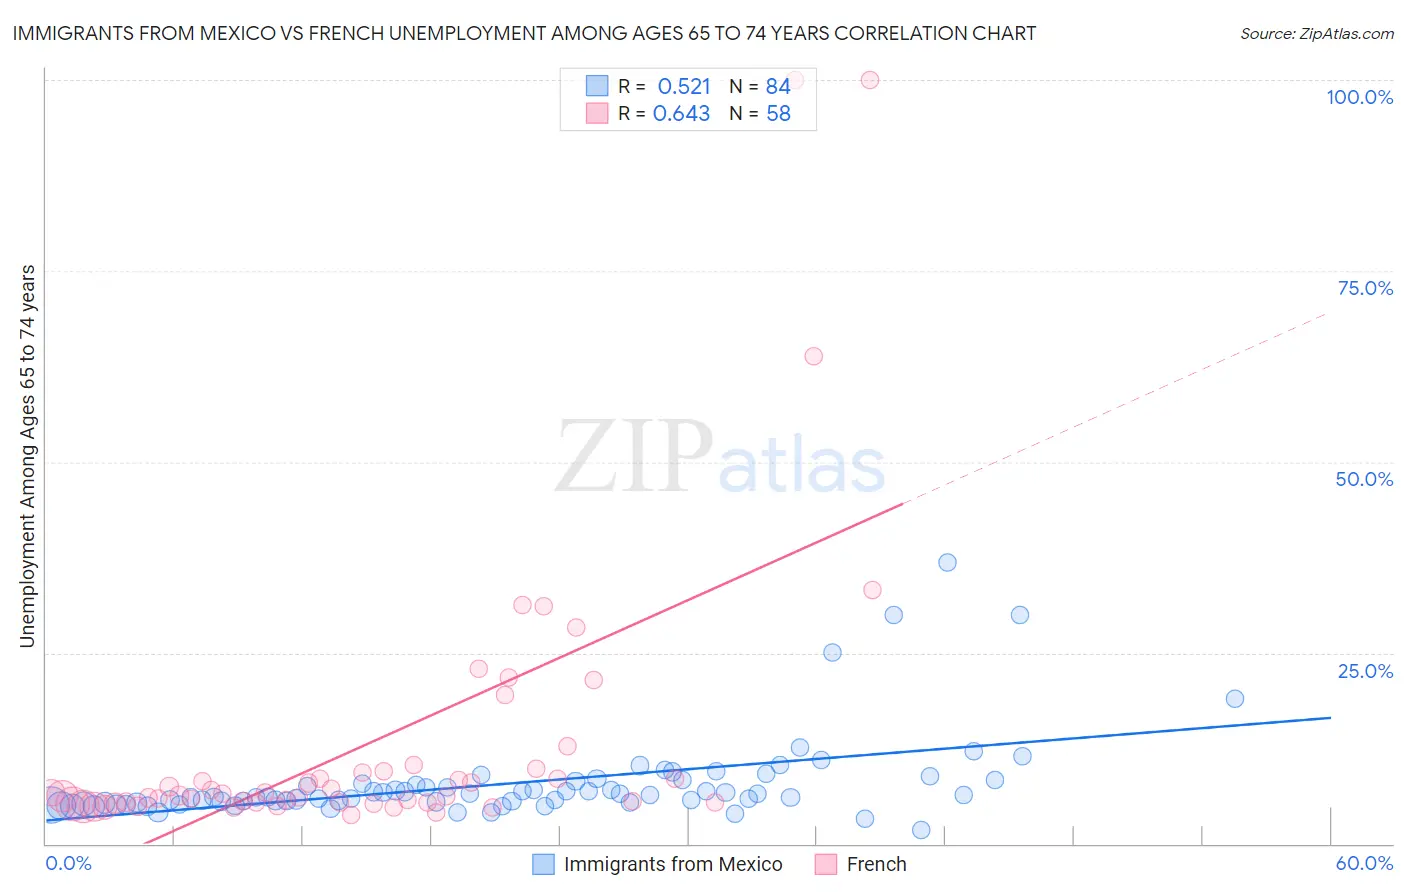
Immigrants from Mexico vs French Unemployment Among Ages 65 to 74 years Correlation Chart

The statistical analysis conducted on geographies consisting of 419,156,044 people shows a substantial positive correlation between the proportion of Immigrants from Mexico and unemployment rate among population between the ages 65 and 74 in the United States with a correlation coefficient (R) of 0.521 and weighted average of 6.0%. Similarly, the statistical analysis conducted on geographies consisting of 445,827,380 people shows a significant positive correlation between the proportion of French and unemployment rate among population between the ages 65 and 74 in the United States with a correlation coefficient (R) of 0.643 and weighted average of 5.4%, a difference of 11.2%.
Immigrants from Mexico vs French Unemployment Among Ages 65 to 74 years

Unemployment Among Ages 65 to 74 years Correlation Summary

MeasurementImmigrants from MexicoFrench
Minimum1.8%3.8%
Maximum36.8%100.0%
Range35.0%96.2%
Mean7.9%13.4%
Median6.3%6.5%
Interquartile 25% (IQ1)5.4%5.4%
Interquartile 75% (IQ3)8.0%9.6%
Interquartile Range (IQR)2.6%4.2%
Standard Deviation (Sample)5.7%19.4%
Standard Deviation (Population)5.6%19.2%

Similar Demographics by Unemployment Among Ages 65 to 74 years

Demographics Similar to Immigrants from Mexico by Unemployment Among Ages 65 to 74 years

In terms of unemployment among ages 65 to 74 years, the demographic groups most similar to Immigrants from Mexico are Delaware (6.0%, a difference of 0.060%), Immigrants from Dominica (6.0%, a difference of 0.22%), Immigrants from Bahamas (5.9%, a difference of 0.59%), Tohono O'odham (6.0%, a difference of 0.63%), and Aleut (5.9%, a difference of 0.68%).
DemographicsRating | RankUnemployment Among Ages 65 to 74 years
Immigrants | Guatemala
0.0
/100
|
#315
Tragic
5.9%
Immigrants | El Salvador
0.0
/100
|
#316
Tragic
5.9%
Immigrants | Central America
0.0
/100
|
#317
Tragic
5.9%
Zimbabweans
0.0
/100
|
#318
Tragic
5.9%
Aleuts
0.0
/100
|
#319
Tragic
5.9%
Immigrants | Bahamas
0.0
/100
|
#320
Tragic
5.9%
Immigrants | Dominica
0.0
/100
|
#321
Tragic
6.0%
Immigrants | Mexico
0.0
/100
|
#322
Tragic
6.0%
Delaware
0.0
/100
|
#323
Tragic
6.0%
Tohono O'odham
0.0
/100
|
#324
Tragic
6.0%
Immigrants | Portugal
0.0
/100
|
#325
Tragic
6.0%
Natives/Alaskans
0.0
/100
|
#326
Tragic
6.0%
Shoshone
0.0
/100
|
#327
Tragic
6.2%
Immigrants | Azores
0.0
/100
|
#328
Tragic
6.2%
Yuman
0.0
/100
|
#329
Tragic
6.2%

Demographics Similar to French by Unemployment Among Ages 65 to 74 years

In terms of unemployment among ages 65 to 74 years, the demographic groups most similar to French are Guamanian/Chamorro (5.4%, a difference of 0.030%), Immigrants from Ireland (5.4%, a difference of 0.040%), Soviet Union (5.4%, a difference of 0.11%), Arab (5.4%, a difference of 0.12%), and Immigrants from Western Europe (5.4%, a difference of 0.14%).
DemographicsRating | RankUnemployment Among Ages 65 to 74 years
Panamanians
51.8
/100
|
#171
Average
5.4%
Greeks
51.1
/100
|
#172
Average
5.4%
Immigrants | Northern Europe
51.1
/100
|
#173
Average
5.4%
Potawatomi
50.0
/100
|
#174
Average
5.4%
Immigrants | Iran
49.0
/100
|
#175
Average
5.4%
Immigrants | Western Europe
47.3
/100
|
#176
Average
5.4%
Arabs
46.8
/100
|
#177
Average
5.4%
French
43.1
/100
|
#178
Average
5.4%
Guamanians/Chamorros
42.1
/100
|
#179
Average
5.4%
Immigrants | Ireland
42.0
/100
|
#180
Average
5.4%
Soviet Union
40.0
/100
|
#181
Fair
5.4%
Spanish Americans
38.2
/100
|
#182
Fair
5.4%
Immigrants | Spain
37.3
/100
|
#183
Fair
5.4%
Immigrants | Senegal
35.2
/100
|
#184
Fair
5.4%
Russians
34.4
/100
|
#185
Fair
5.4%