Immigrants from Mexico vs French Householder Income Ages 25 - 44 years

COMPARE

Immigrants from Mexico
Race
Ancestry
AfghanAfricanAlaska NativeAlaskan AthabascanAlbanianAleutAlsatianAmericanApacheArabArapahoArgentineanArmenianAssyrian/Chaldean/SyriacAustralianAustrianBahamianBangladeshiBarbadianBasqueBelgianBelizeanBermudanBhutaneseBlackfeetBolivianBrazilianBritishBritish West IndianBulgarianBurmeseCajunCambodianCanadianCape VerdeanCarpatho RusynCelticCentral AmericanCentral American IndianCherokeeCheyenneChickasawChileanChineseChippewaChoctawColombianColvilleComancheCosta RicanCreeCreekCroatianCrowCubanCypriotCzechCzechoslovakianDanishDelawareDominicanDutchDutch West IndianEastern EuropeanEcuadorianEgyptianEnglishEstonianEthiopianEuropeanFijianFilipinoFinnishFrench American IndianFrench CanadianGermanGerman RussianGhanaianGreekGuamanian/ChamorroGuatemalanGuyaneseHaitianHmongHonduranHopiHoumaHungarianIcelanderIndian (Asian)IndonesianInupiatIranianIraqiIrishIroquoisIsraeliItalianJamaicanJapaneseJordanianKenyanKiowaKoreanLaotianLatvianLebaneseLiberianLithuanianLumbeeLuxembourgerMacedonianMalaysianMalteseMarshalleseMenomineeMexicanMexican American IndianMongolianMoroccanNative HawaiianNavajoNepaleseNew ZealanderNicaraguanNigerianNorthern EuropeanNorwegianOkinawanOsageOttawaPaiutePakistaniPalestinianPanamanianParaguayanPennsylvania GermanPeruvianPimaPolishPortuguesePotawatomiPuebloPuerto RicanPuget Sound SalishRomanianRussianSalvadoranSamoanScandinavianScotch-IrishScottishSeminoleSenegaleseSerbianShoshoneSierra LeoneanSiouxSlavicSlovakSloveneSomaliSouth AfricanSouth AmericanSouth American IndianSoviet UnionSpaniardSpanishSpanish AmericanSpanish American IndianSri LankanSubsaharan AfricanSudaneseSwedishSwissSyrianTaiwaneseThaiTlingit-HaidaTohono O'OdhamTonganTrinidadian and TobagonianTsimshianTurkishU.S. Virgin IslanderUgandanUkrainianUruguayanUteVenezuelanVietnameseWelshWest IndianYakamaYaquiYugoslavianYumanYup'ikZimbabwean
Immigration
NonimmigrantsImmigrantsAfghanistanAfricaAlbaniaArgentinaArmeniaAsiaAustraliaAustriaBahamasBangladeshBarbadosBelarusBelgiumBelizeBoliviaBosnia and HerzegovinaBrazilBulgariaBurma/MyanmarCabo VerdeCambodiaCameroonCanadaCaribbeanCentral AmericaChileChinaColombiaCongoCosta RicaCroatiaCubaCzechoslovakiaDenmarkDominicaDominican RepublicEastern AfricaEastern AsiaEastern EuropeEcuadorEgyptEl SalvadorEnglandEritreaEthiopiaEuropeFijiFranceGermanyGhanaGreeceGrenadaGuatemalaGuyanaHaitiHondurasHong KongHungaryIndiaIndonesiaIranIraqIrelandIsraelItalyJamaicaJapanJordanKazakhstanKenyaKoreaKuwaitLaosLatin AmericaLatviaLebanonLiberiaLithuaniaMalaysiaMexicoMicronesiaMiddle AfricaMoldovaMoroccoNepalNetherlandsNicaraguaNigeriaNorth AmericaNorth MacedoniaNorthern AfricaNorthern EuropeNorwayOceaniaPakistanPanamaPeruPhilippinesPolandPortugalRomaniaRussiaSaudi ArabiaScotlandSenegalSerbiaSierra LeoneSingaporeSomaliaSouth AfricaSouth AmericaSouth Central AsiaSouth Eastern AsiaSouthern EuropeSpainSri LankaSt. Vincent and the GrenadinesSudanSwedenSwitzerlandSyriaTaiwanThailandTrinidad and TobagoTurkeyUgandaUkraineUruguayUzbekistanVenezuelaVietnamWest IndiesWestern AfricaWestern AsiaWestern EuropeYemenZaireZimbabweAzores
French
Race
Ancestry
AfghanAfricanAlaska NativeAlaskan AthabascanAlbanianAleutAlsatianAmericanApacheArabArapahoArgentineanArmenianAssyrian/Chaldean/SyriacAustralianAustrianBahamianBangladeshiBarbadianBasqueBelgianBelizeanBermudanBhutaneseBlackfeetBolivianBrazilianBritishBritish West IndianBulgarianBurmeseCajunCambodianCanadianCape VerdeanCarpatho RusynCelticCentral AmericanCentral American IndianCherokeeCheyenneChickasawChileanChineseChippewaChoctawColombianColvilleComancheCosta RicanCreeCreekCroatianCrowCubanCypriotCzechCzechoslovakianDanishDelawareDominicanDutchDutch West IndianEastern EuropeanEcuadorianEgyptianEnglishEstonianEthiopianEuropeanFijianFilipinoFinnishFrenchFrench American IndianFrench CanadianGermanGerman RussianGhanaianGreekGuamanian/ChamorroGuatemalanGuyaneseHaitianHmongHonduranHopiHoumaHungarianIcelanderIndian (Asian)IndonesianInupiatIranianIraqiIrishIroquoisIsraeliItalianJamaicanJapaneseJordanianKenyanKiowaKoreanLaotianLatvianLebaneseLiberianLithuanianLumbeeLuxembourgerMacedonianMalaysianMalteseMarshalleseMenomineeMexicanMexican American IndianMongolianMoroccanNative HawaiianNavajoNepaleseNew ZealanderNicaraguanNigerianNorthern EuropeanNorwegianOkinawanOsageOttawaPaiutePakistaniPalestinianPanamanianParaguayanPennsylvania GermanPeruvianPimaPolishPortuguesePotawatomiPuebloPuerto RicanPuget Sound SalishRomanianRussianSalvadoranSamoanScandinavianScotch-IrishScottishSeminoleSenegaleseSerbianShoshoneSierra LeoneanSiouxSlavicSlovakSloveneSomaliSouth AfricanSouth AmericanSouth American IndianSoviet UnionSpaniardSpanishSpanish AmericanSpanish American IndianSri LankanSubsaharan AfricanSudaneseSwedishSwissSyrianTaiwaneseThaiTlingit-HaidaTohono O'OdhamTonganTrinidadian and TobagonianTsimshianTurkishU.S. Virgin IslanderUgandanUkrainianUruguayanUteVenezuelanVietnameseWelshWest IndianYakamaYaquiYugoslavianYumanYup'ikZimbabwean
Immigration
NonimmigrantsImmigrantsAfghanistanAfricaAlbaniaArgentinaArmeniaAsiaAustraliaAustriaBahamasBangladeshBarbadosBelarusBelgiumBelizeBoliviaBosnia and HerzegovinaBrazilBulgariaBurma/MyanmarCabo VerdeCambodiaCameroonCanadaCaribbeanCentral AmericaChileChinaColombiaCongoCosta RicaCroatiaCubaCzechoslovakiaDenmarkDominicaDominican RepublicEastern AfricaEastern AsiaEastern EuropeEcuadorEgyptEl SalvadorEnglandEritreaEthiopiaEuropeFijiFranceGermanyGhanaGreeceGrenadaGuatemalaGuyanaHaitiHondurasHong KongHungaryIndiaIndonesiaIranIraqIrelandIsraelItalyJamaicaJapanJordanKazakhstanKenyaKoreaKuwaitLaosLatin AmericaLatviaLebanonLiberiaLithuaniaMalaysiaMicronesiaMiddle AfricaMoldovaMoroccoNepalNetherlandsNicaraguaNigeriaNorth AmericaNorth MacedoniaNorthern AfricaNorthern EuropeNorwayOceaniaPakistanPanamaPeruPhilippinesPolandPortugalRomaniaRussiaSaudi ArabiaScotlandSenegalSerbiaSierra LeoneSingaporeSomaliaSouth AfricaSouth AmericaSouth Central AsiaSouth Eastern AsiaSouthern EuropeSpainSri LankaSt. Vincent and the GrenadinesSudanSwedenSwitzerlandSyriaTaiwanThailandTrinidad and TobagoTurkeyUgandaUkraineUruguayUzbekistanVenezuelaVietnamWest IndiesWestern AfricaWestern AsiaWestern EuropeYemenZaireZimbabweAzores
Householder Income Ages 25 - 44 years
Income
Poverty
Unemployment
Labor Participation
Family Structure
Vehicle Availability
Education Level
Disability

Householder Income Ages 25 - 44 years Comparison

Immigrants from Mexico

French

Tragic
Fair
$78,809
HOUSEHOLDER INCOME AGES 25 - 44 YEARS
0.0/ 100
METRIC RATING
318th/ 347
METRIC RANK
$93,665
HOUSEHOLDER INCOME AGES 25 - 44 YEARS
37.8/ 100
METRIC RATING
180th/ 347
METRIC RANK

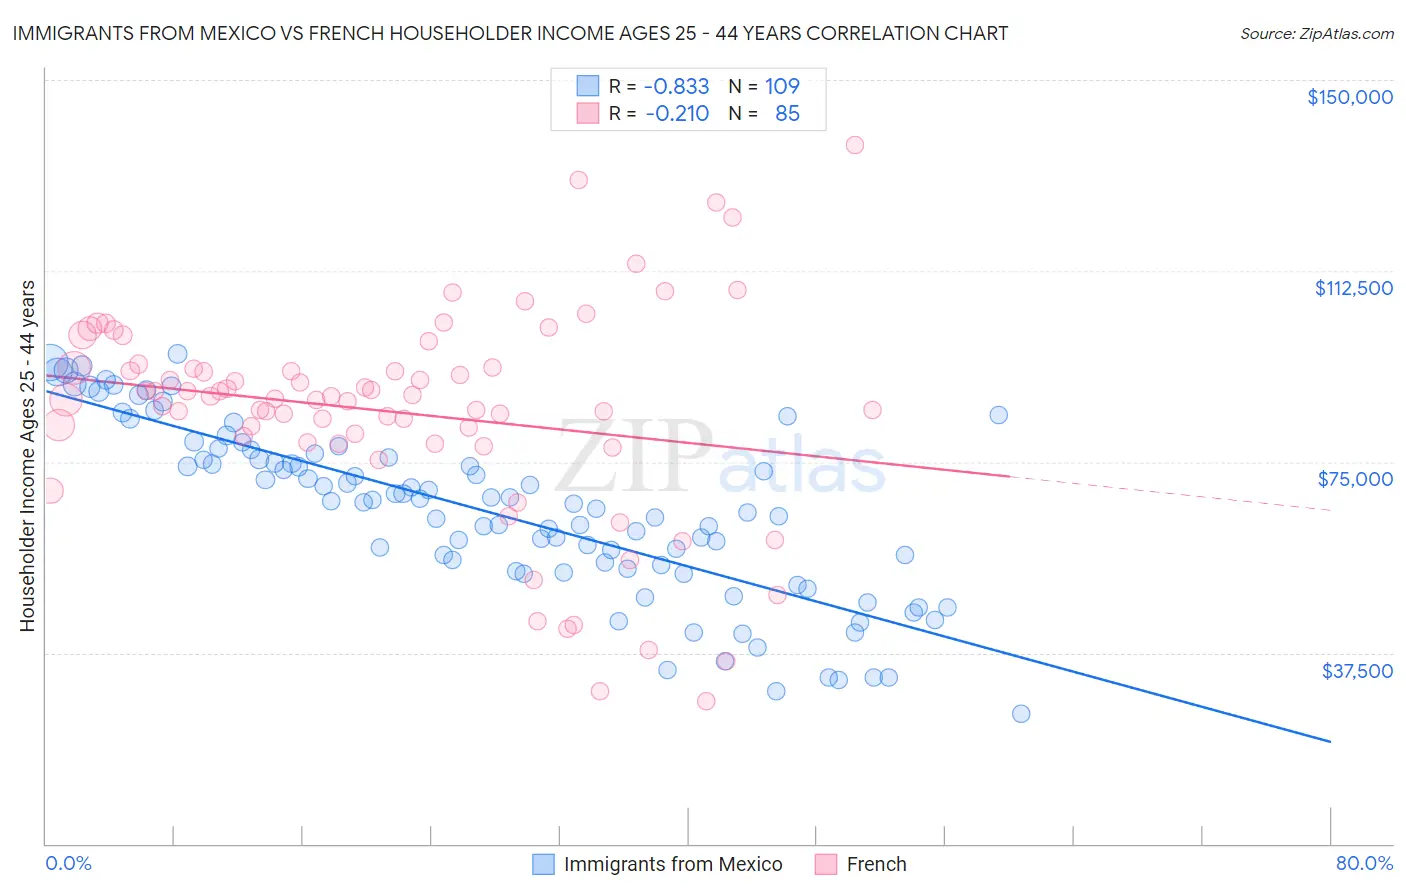
Immigrants from Mexico vs French Householder Income Ages 25 - 44 years Correlation Chart

The statistical analysis conducted on geographies consisting of 510,586,481 people shows a very strong negative correlation between the proportion of Immigrants from Mexico and household income with householder between the ages 25 and 44 in the United States with a correlation coefficient (R) of -0.833 and weighted average of $78,809. Similarly, the statistical analysis conducted on geographies consisting of 566,574,602 people shows a weak negative correlation between the proportion of French and household income with householder between the ages 25 and 44 in the United States with a correlation coefficient (R) of -0.210 and weighted average of $93,665, a difference of 18.9%.
Immigrants from Mexico vs French Householder Income Ages 25 - 44 years

Householder Income Ages 25 - 44 years Correlation Summary

MeasurementImmigrants from MexicoFrench
Minimum$25,500$28,047
Maximum$96,265$137,237
Range$70,765$109,190
Mean$65,144$84,736
Median$66,989$87,325
Interquartile 25% (IQ1)$53,834$78,650
Interquartile 75% (IQ3)$76,158$93,493
Interquartile Range (IQR)$22,324$14,843
Standard Deviation (Sample)$16,884$21,004
Standard Deviation (Population)$16,806$20,880

Similar Demographics by Householder Income Ages 25 - 44 years

Demographics Similar to Immigrants from Mexico by Householder Income Ages 25 - 44 years

In terms of householder income ages 25 - 44 years, the demographic groups most similar to Immigrants from Mexico are U.S. Virgin Islander ($78,911, a difference of 0.13%), African ($78,986, a difference of 0.22%), Ottawa ($79,012, a difference of 0.26%), Honduran ($78,540, a difference of 0.34%), and Cheyenne ($79,152, a difference of 0.44%).
DemographicsRating | RankHouseholder Income Ages 25 - 44 years
Indonesians
0.0
/100
|
#311
Tragic
$79,543
Immigrants | Haiti
0.0
/100
|
#312
Tragic
$79,391
Menominee
0.0
/100
|
#313
Tragic
$79,358
Cheyenne
0.0
/100
|
#314
Tragic
$79,152
Ottawa
0.0
/100
|
#315
Tragic
$79,012
Africans
0.0
/100
|
#316
Tragic
$78,986
U.S. Virgin Islanders
0.0
/100
|
#317
Tragic
$78,911
Immigrants | Mexico
0.0
/100
|
#318
Tragic
$78,809
Hondurans
0.0
/100
|
#319
Tragic
$78,540
Choctaw
0.0
/100
|
#320
Tragic
$78,168
Immigrants | Zaire
0.0
/100
|
#321
Tragic
$78,045
Chickasaw
0.0
/100
|
#322
Tragic
$77,929
Immigrants | Honduras
0.0
/100
|
#323
Tragic
$77,328
Dutch West Indians
0.0
/100
|
#324
Tragic
$77,260
Sioux
0.0
/100
|
#325
Tragic
$77,089

Demographics Similar to French by Householder Income Ages 25 - 44 years

In terms of householder income ages 25 - 44 years, the demographic groups most similar to French are Puget Sound Salish ($93,661, a difference of 0.0%), French Canadian ($93,694, a difference of 0.030%), Uruguayan ($93,631, a difference of 0.040%), Guamanian/Chamorro ($93,569, a difference of 0.10%), and German ($93,531, a difference of 0.14%).
DemographicsRating | RankHouseholder Income Ages 25 - 44 years
Finns
50.6
/100
|
#173
Average
$94,610
Colombians
50.0
/100
|
#174
Average
$94,565
English
48.1
/100
|
#175
Average
$94,429
Immigrants | Immigrants
48.0
/100
|
#176
Average
$94,423
Belgians
45.8
/100
|
#177
Average
$94,262
Immigrants | South America
42.8
/100
|
#178
Average
$94,042
French Canadians
38.2
/100
|
#179
Fair
$93,694
French
37.8
/100
|
#180
Fair
$93,665
Puget Sound Salish
37.7
/100
|
#181
Fair
$93,661
Uruguayans
37.3
/100
|
#182
Fair
$93,631
Guamanians/Chamorros
36.5
/100
|
#183
Fair
$93,569
Germans
36.0
/100
|
#184
Fair
$93,531
Immigrants | Eritrea
35.2
/100
|
#185
Fair
$93,466
Sierra Leoneans
34.8
/100
|
#186
Fair
$93,435
Spaniards
34.0
/100
|
#187
Fair
$93,366