Immigrants from Lithuania vs Immigrants from Croatia Male Unemployment
COMPARE
Immigrants from Lithuania
Immigrants from Croatia
Male Unemployment
Male Unemployment Comparison
Immigrants from Lithuania
Immigrants from Croatia
5.1%
MALE UNEMPLOYMENT
87.2/ 100
METRIC RATING
125th/ 347
METRIC RANK
5.2%
MALE UNEMPLOYMENT
79.7/ 100
METRIC RATING
138th/ 347
METRIC RANK
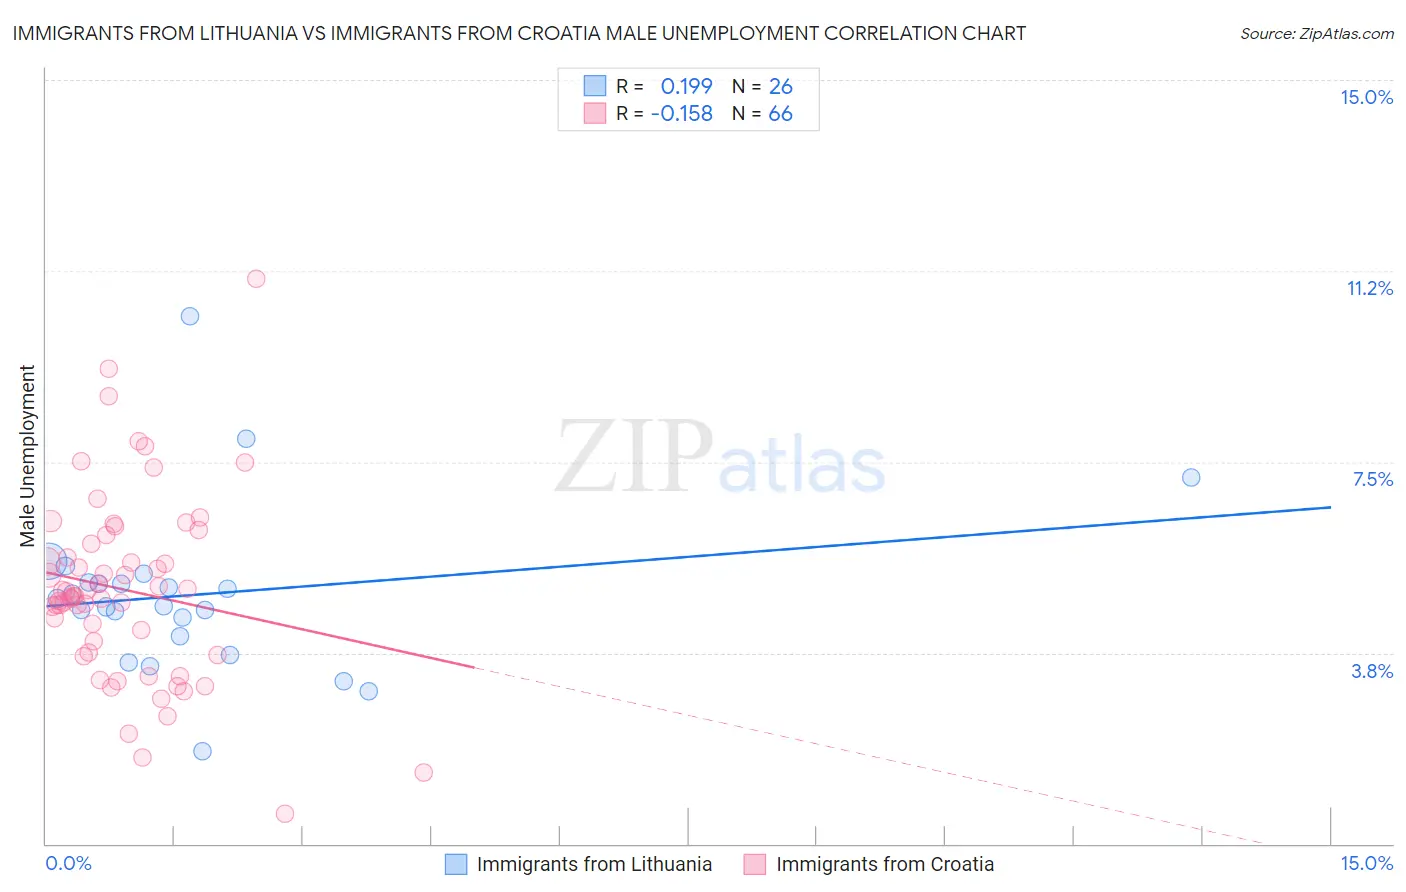
Immigrants from Lithuania vs Immigrants from Croatia Male Unemployment Correlation Chart
The statistical analysis conducted on geographies consisting of 117,611,759 people shows a poor positive correlation between the proportion of Immigrants from Lithuania and unemployment rate among males in the United States with a correlation coefficient (R) of 0.199 and weighted average of 5.1%. Similarly, the statistical analysis conducted on geographies consisting of 132,444,179 people shows a poor negative correlation between the proportion of Immigrants from Croatia and unemployment rate among males in the United States with a correlation coefficient (R) of -0.158 and weighted average of 5.2%, a difference of 0.83%.
Male Unemployment Correlation Summary
| Measurement | Immigrants from Lithuania | Immigrants from Croatia |
| Minimum | 1.8% | 0.60% |
| Maximum | 10.4% | 11.1% |
| Range | 8.5% | 10.5% |
| Mean | 4.9% | 5.0% |
| Median | 4.7% | 4.9% |
| Interquartile 25% (IQ1) | 4.1% | 3.8% |
| Interquartile 75% (IQ3) | 5.1% | 5.9% |
| Interquartile Range (IQR) | 1.1% | 2.1% |
| Standard Deviation (Sample) | 1.6% | 1.8% |
| Standard Deviation (Population) | 1.6% | 1.8% |
Demographics Similar to Immigrants from Lithuania and Immigrants from Croatia by Male Unemployment
In terms of male unemployment, the demographic groups most similar to Immigrants from Lithuania are Immigrants from Latvia (5.1%, a difference of 0.040%), Immigrants from Colombia (5.1%, a difference of 0.060%), Palestinian (5.1%, a difference of 0.070%), Immigrants from Brazil (5.2%, a difference of 0.11%), and Nicaraguan (5.1%, a difference of 0.14%). Similarly, the demographic groups most similar to Immigrants from Croatia are Immigrants from Eastern Africa (5.2%, a difference of 0.010%), Lebanese (5.2%, a difference of 0.020%), Kenyan (5.2%, a difference of 0.020%), Brazilian (5.2%, a difference of 0.030%), and Immigrants from Saudi Arabia (5.2%, a difference of 0.040%).
| Demographics | Rating | Rank | Male Unemployment |
| Mongolians | 88.4 /100 | #121 | Excellent 5.1% |
| Nicaraguans | 88.2 /100 | #122 | Excellent 5.1% |
| Palestinians | 87.7 /100 | #123 | Excellent 5.1% |
| Immigrants | Latvia | 87.5 /100 | #124 | Excellent 5.1% |
| Immigrants | Lithuania | 87.2 /100 | #125 | Excellent 5.1% |
| Immigrants | Colombia | 86.8 /100 | #126 | Excellent 5.1% |
| Immigrants | Brazil | 86.3 /100 | #127 | Excellent 5.2% |
| Hungarians | 85.1 /100 | #128 | Excellent 5.2% |
| Immigrants | Western Europe | 84.8 /100 | #129 | Excellent 5.2% |
| Immigrants | Malaysia | 83.5 /100 | #130 | Excellent 5.2% |
| Immigrants | Germany | 83.0 /100 | #131 | Excellent 5.2% |
| Chickasaw | 82.9 /100 | #132 | Excellent 5.2% |
| Colombians | 81.1 /100 | #133 | Excellent 5.2% |
| Pakistanis | 80.5 /100 | #134 | Excellent 5.2% |
| Immigrants | Saudi Arabia | 80.1 /100 | #135 | Excellent 5.2% |
| Lebanese | 79.9 /100 | #136 | Good 5.2% |
| Immigrants | Eastern Africa | 79.8 /100 | #137 | Good 5.2% |
| Immigrants | Croatia | 79.7 /100 | #138 | Good 5.2% |
| Kenyans | 79.4 /100 | #139 | Good 5.2% |
| Brazilians | 79.3 /100 | #140 | Good 5.2% |
| Immigrants | Switzerland | 79.2 /100 | #141 | Good 5.2% |