Basque vs Immigrants from Croatia Male Unemployment
COMPARE
Basque
Immigrants from Croatia
Male Unemployment
Male Unemployment Comparison
Basques
Immigrants from Croatia
5.0%
MALE UNEMPLOYMENT
97.9/ 100
METRIC RATING
62nd/ 347
METRIC RANK
5.2%
MALE UNEMPLOYMENT
79.7/ 100
METRIC RATING
138th/ 347
METRIC RANK
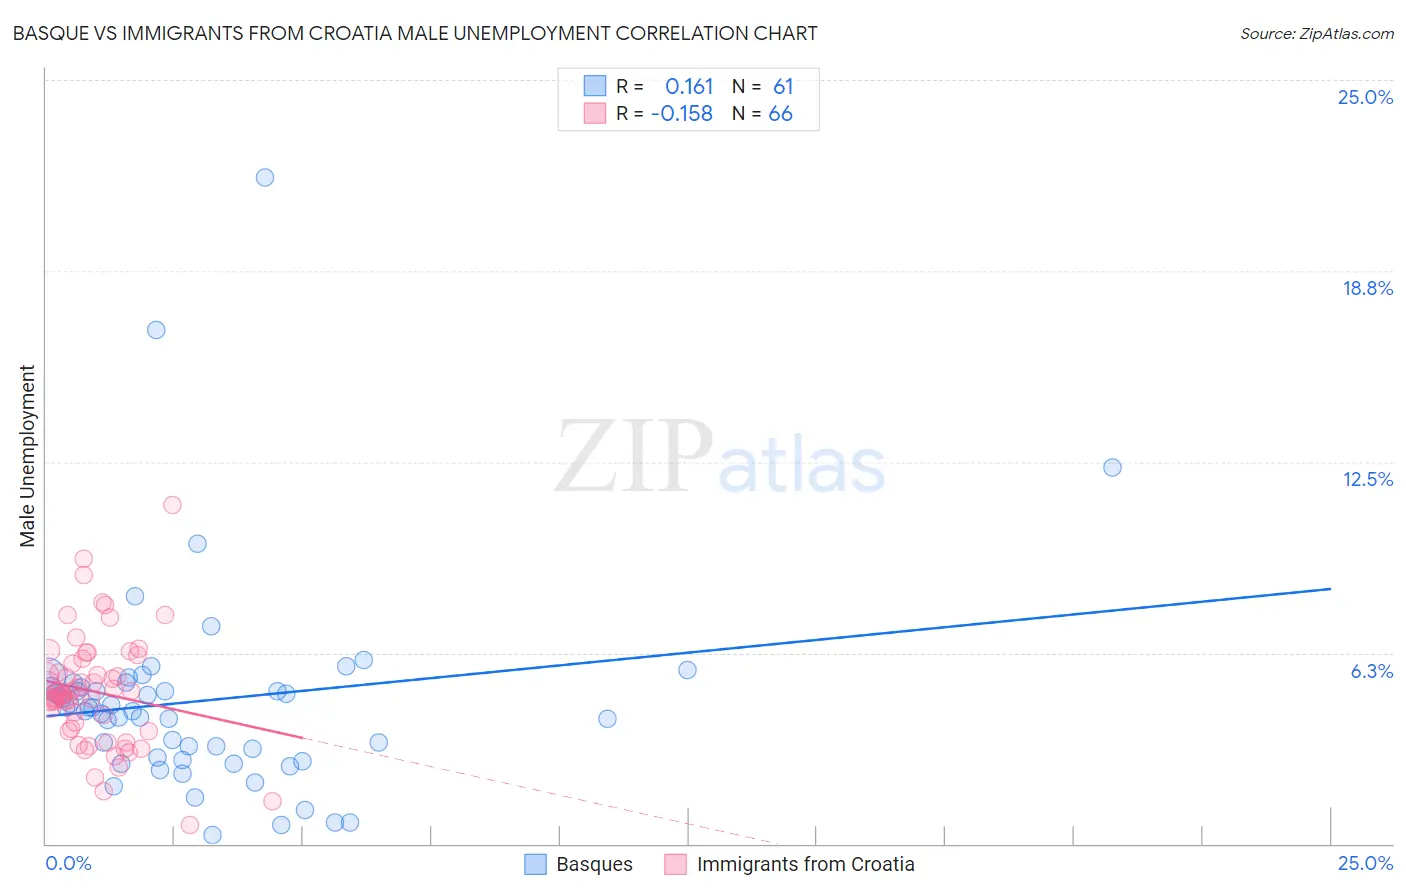
Basque vs Immigrants from Croatia Male Unemployment Correlation Chart
The statistical analysis conducted on geographies consisting of 165,517,364 people shows a poor positive correlation between the proportion of Basques and unemployment rate among males in the United States with a correlation coefficient (R) of 0.161 and weighted average of 5.0%. Similarly, the statistical analysis conducted on geographies consisting of 132,444,179 people shows a poor negative correlation between the proportion of Immigrants from Croatia and unemployment rate among males in the United States with a correlation coefficient (R) of -0.158 and weighted average of 5.2%, a difference of 3.8%.
Male Unemployment Correlation Summary
| Measurement | Basque | Immigrants from Croatia |
| Minimum | 0.30% | 0.60% |
| Maximum | 21.8% | 11.1% |
| Range | 21.5% | 10.5% |
| Mean | 4.7% | 5.0% |
| Median | 4.4% | 4.9% |
| Interquartile 25% (IQ1) | 2.8% | 3.8% |
| Interquartile 75% (IQ3) | 5.2% | 5.9% |
| Interquartile Range (IQR) | 2.4% | 2.1% |
| Standard Deviation (Sample) | 3.4% | 1.8% |
| Standard Deviation (Population) | 3.4% | 1.8% |
Similar Demographics by Male Unemployment
Demographics Similar to Basques by Male Unemployment
In terms of male unemployment, the demographic groups most similar to Basques are Eastern European (5.0%, a difference of 0.010%), Celtic (5.0%, a difference of 0.030%), Cambodian (5.0%, a difference of 0.13%), Icelander (5.0%, a difference of 0.19%), and Immigrants from Argentina (5.0%, a difference of 0.20%).
| Demographics | Rating | Rank | Male Unemployment |
| Czechoslovakians | 98.7 /100 | #55 | Exceptional 5.0% |
| Immigrants | Bulgaria | 98.7 /100 | #56 | Exceptional 5.0% |
| Turks | 98.5 /100 | #57 | Exceptional 5.0% |
| Lithuanians | 98.5 /100 | #58 | Exceptional 5.0% |
| Immigrants | Netherlands | 98.3 /100 | #59 | Exceptional 5.0% |
| Immigrants | Argentina | 98.1 /100 | #60 | Exceptional 5.0% |
| Cambodians | 98.1 /100 | #61 | Exceptional 5.0% |
| Basques | 97.9 /100 | #62 | Exceptional 5.0% |
| Eastern Europeans | 97.9 /100 | #63 | Exceptional 5.0% |
| Celtics | 97.8 /100 | #64 | Exceptional 5.0% |
| Icelanders | 97.6 /100 | #65 | Exceptional 5.0% |
| Finns | 97.5 /100 | #66 | Exceptional 5.0% |
| Immigrants | Canada | 97.5 /100 | #67 | Exceptional 5.0% |
| Australians | 97.4 /100 | #68 | Exceptional 5.0% |
| Immigrants | Sweden | 97.4 /100 | #69 | Exceptional 5.0% |
Demographics Similar to Immigrants from Croatia by Male Unemployment
In terms of male unemployment, the demographic groups most similar to Immigrants from Croatia are Immigrants from Eastern Africa (5.2%, a difference of 0.010%), Lebanese (5.2%, a difference of 0.020%), Kenyan (5.2%, a difference of 0.020%), Brazilian (5.2%, a difference of 0.030%), and Immigrants from Saudi Arabia (5.2%, a difference of 0.040%).
| Demographics | Rating | Rank | Male Unemployment |
| Immigrants | Germany | 83.0 /100 | #131 | Excellent 5.2% |
| Chickasaw | 82.9 /100 | #132 | Excellent 5.2% |
| Colombians | 81.1 /100 | #133 | Excellent 5.2% |
| Pakistanis | 80.5 /100 | #134 | Excellent 5.2% |
| Immigrants | Saudi Arabia | 80.1 /100 | #135 | Excellent 5.2% |
| Lebanese | 79.9 /100 | #136 | Good 5.2% |
| Immigrants | Eastern Africa | 79.8 /100 | #137 | Good 5.2% |
| Immigrants | Croatia | 79.7 /100 | #138 | Good 5.2% |
| Kenyans | 79.4 /100 | #139 | Good 5.2% |
| Brazilians | 79.3 /100 | #140 | Good 5.2% |
| Immigrants | Switzerland | 79.2 /100 | #141 | Good 5.2% |
| Fijians | 78.3 /100 | #142 | Good 5.2% |
| Syrians | 78.0 /100 | #143 | Good 5.2% |
| Sri Lankans | 77.9 /100 | #144 | Good 5.2% |
| Macedonians | 77.7 /100 | #145 | Good 5.2% |