Immigrants from Liberia vs Immigrants from Israel Female Unemployment
COMPARE
Immigrants from Liberia
Immigrants from Israel
Female Unemployment
Female Unemployment Comparison
Immigrants from Liberia
Immigrants from Israel
5.6%
FEMALE UNEMPLOYMENT
1.5/ 100
METRIC RATING
244th/ 347
METRIC RANK
5.4%
FEMALE UNEMPLOYMENT
19.7/ 100
METRIC RATING
204th/ 347
METRIC RANK
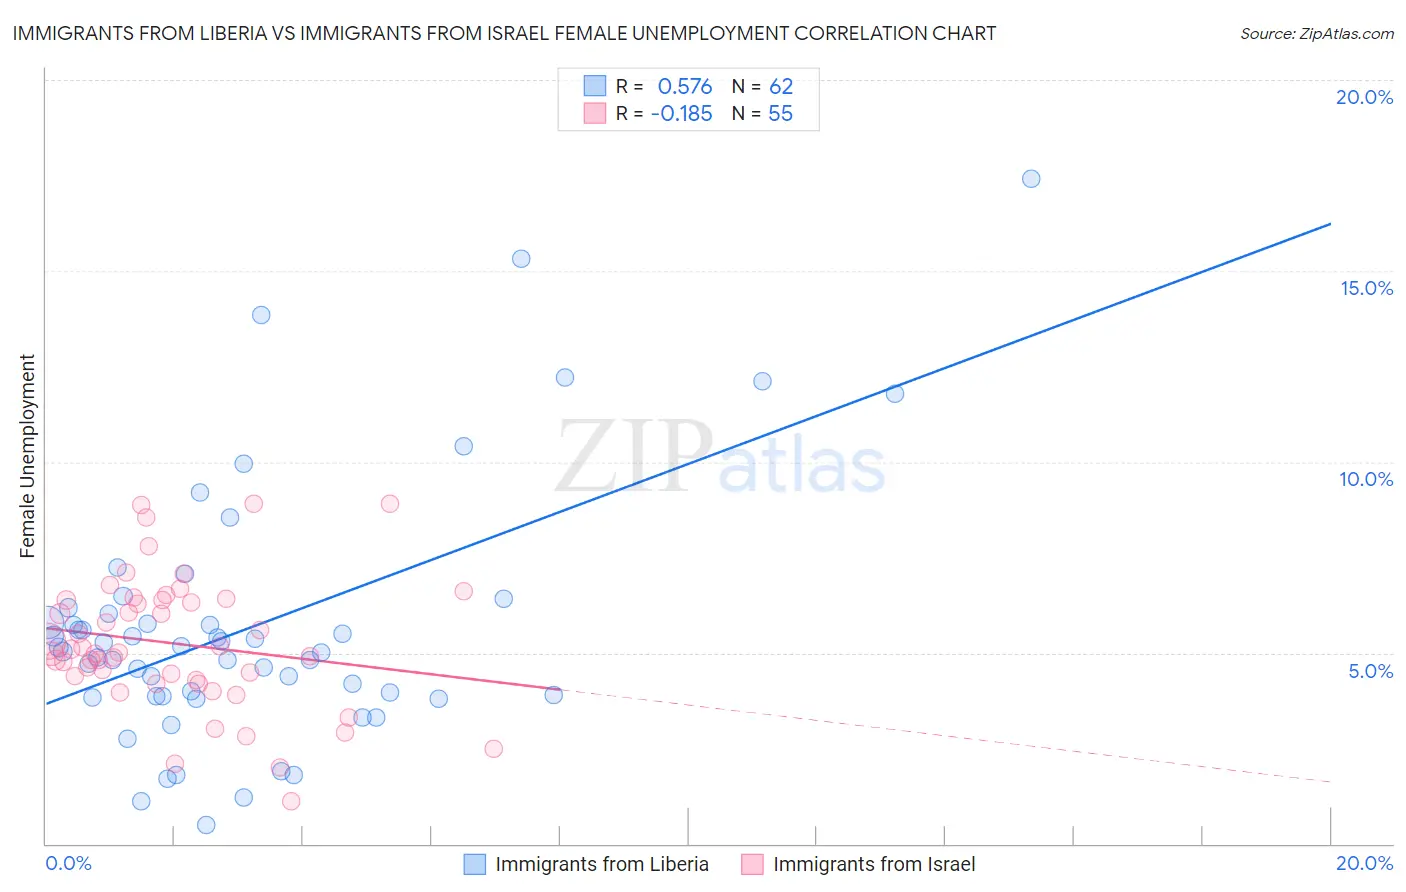
Immigrants from Liberia vs Immigrants from Israel Female Unemployment Correlation Chart
The statistical analysis conducted on geographies consisting of 135,123,967 people shows a substantial positive correlation between the proportion of Immigrants from Liberia and unemploymnet rate among females in the United States with a correlation coefficient (R) of 0.576 and weighted average of 5.6%. Similarly, the statistical analysis conducted on geographies consisting of 209,717,487 people shows a poor negative correlation between the proportion of Immigrants from Israel and unemploymnet rate among females in the United States with a correlation coefficient (R) of -0.185 and weighted average of 5.4%, a difference of 4.1%.
Female Unemployment Correlation Summary
| Measurement | Immigrants from Liberia | Immigrants from Israel |
| Minimum | 0.50% | 1.1% |
| Maximum | 17.4% | 8.9% |
| Range | 16.9% | 7.8% |
| Mean | 5.7% | 5.2% |
| Median | 5.1% | 5.0% |
| Interquartile 25% (IQ1) | 3.9% | 4.3% |
| Interquartile 75% (IQ3) | 6.0% | 6.4% |
| Interquartile Range (IQR) | 2.2% | 2.1% |
| Standard Deviation (Sample) | 3.3% | 1.7% |
| Standard Deviation (Population) | 3.3% | 1.7% |
Similar Demographics by Female Unemployment
Demographics Similar to Immigrants from Liberia by Female Unemployment
In terms of female unemployment, the demographic groups most similar to Immigrants from Liberia are Guamanian/Chamorro (5.6%, a difference of 0.14%), Japanese (5.6%, a difference of 0.37%), Immigrants from Western Asia (5.6%, a difference of 0.45%), Marshallese (5.6%, a difference of 0.55%), and Spanish American (5.6%, a difference of 0.55%).
| Demographics | Rating | Rank | Female Unemployment |
| Immigrants | Panama | 3.2 /100 | #237 | Tragic 5.5% |
| Sierra Leoneans | 3.2 /100 | #238 | Tragic 5.5% |
| Aleuts | 3.0 /100 | #239 | Tragic 5.5% |
| Immigrants | South America | 2.9 /100 | #240 | Tragic 5.5% |
| South American Indians | 2.8 /100 | #241 | Tragic 5.5% |
| Marshallese | 2.3 /100 | #242 | Tragic 5.6% |
| Spanish Americans | 2.2 /100 | #243 | Tragic 5.6% |
| Immigrants | Liberia | 1.5 /100 | #244 | Tragic 5.6% |
| Guamanians/Chamorros | 1.4 /100 | #245 | Tragic 5.6% |
| Japanese | 1.2 /100 | #246 | Tragic 5.6% |
| Immigrants | Western Asia | 1.1 /100 | #247 | Tragic 5.6% |
| Cree | 1.0 /100 | #248 | Tragic 5.6% |
| Immigrants | Uzbekistan | 1.0 /100 | #249 | Tragic 5.6% |
| Immigrants | Syria | 0.8 /100 | #250 | Tragic 5.6% |
| Assyrians/Chaldeans/Syriacs | 0.8 /100 | #251 | Tragic 5.6% |
Demographics Similar to Immigrants from Israel by Female Unemployment
In terms of female unemployment, the demographic groups most similar to Immigrants from Israel are Immigrants from South Eastern Asia (5.4%, a difference of 0.060%), Immigrants from Afghanistan (5.4%, a difference of 0.070%), Immigrants from Brazil (5.4%, a difference of 0.090%), Immigrants from Middle Africa (5.4%, a difference of 0.10%), and Iroquois (5.4%, a difference of 0.10%).
| Demographics | Rating | Rank | Female Unemployment |
| Alsatians | 23.9 /100 | #197 | Fair 5.3% |
| Tsimshian | 23.1 /100 | #198 | Fair 5.4% |
| Hawaiians | 22.2 /100 | #199 | Fair 5.4% |
| Soviet Union | 21.7 /100 | #200 | Fair 5.4% |
| Immigrants | Middle Africa | 20.8 /100 | #201 | Fair 5.4% |
| Iroquois | 20.8 /100 | #202 | Fair 5.4% |
| Immigrants | South Eastern Asia | 20.3 /100 | #203 | Fair 5.4% |
| Immigrants | Israel | 19.7 /100 | #204 | Poor 5.4% |
| Immigrants | Afghanistan | 18.9 /100 | #205 | Poor 5.4% |
| Immigrants | Brazil | 18.8 /100 | #206 | Poor 5.4% |
| Creek | 15.4 /100 | #207 | Poor 5.4% |
| Immigrants | Costa Rica | 13.7 /100 | #208 | Poor 5.4% |
| Koreans | 13.4 /100 | #209 | Poor 5.4% |
| Choctaw | 12.3 /100 | #210 | Poor 5.4% |
| Ottawa | 11.6 /100 | #211 | Poor 5.4% |