Immigrants from Laos vs Trinidadian and Tobagonian Unemployment Among Women with Children Ages 6 to 17 years
COMPARE
Immigrants from Laos
Trinidadian and Tobagonian
Unemployment Among Women with Children Ages 6 to 17 years
Unemployment Among Women with Children Ages 6 to 17 years Comparison
Immigrants from Laos
Trinidadians and Tobagonians
8.2%
UNEMPLOYMENT AMONG WOMEN WITH CHILDREN AGES 6 TO 17 YEARS
100.0/ 100
METRIC RATING
57th/ 347
METRIC RANK
9.1%
UNEMPLOYMENT AMONG WOMEN WITH CHILDREN AGES 6 TO 17 YEARS
18.2/ 100
METRIC RATING
200th/ 347
METRIC RANK
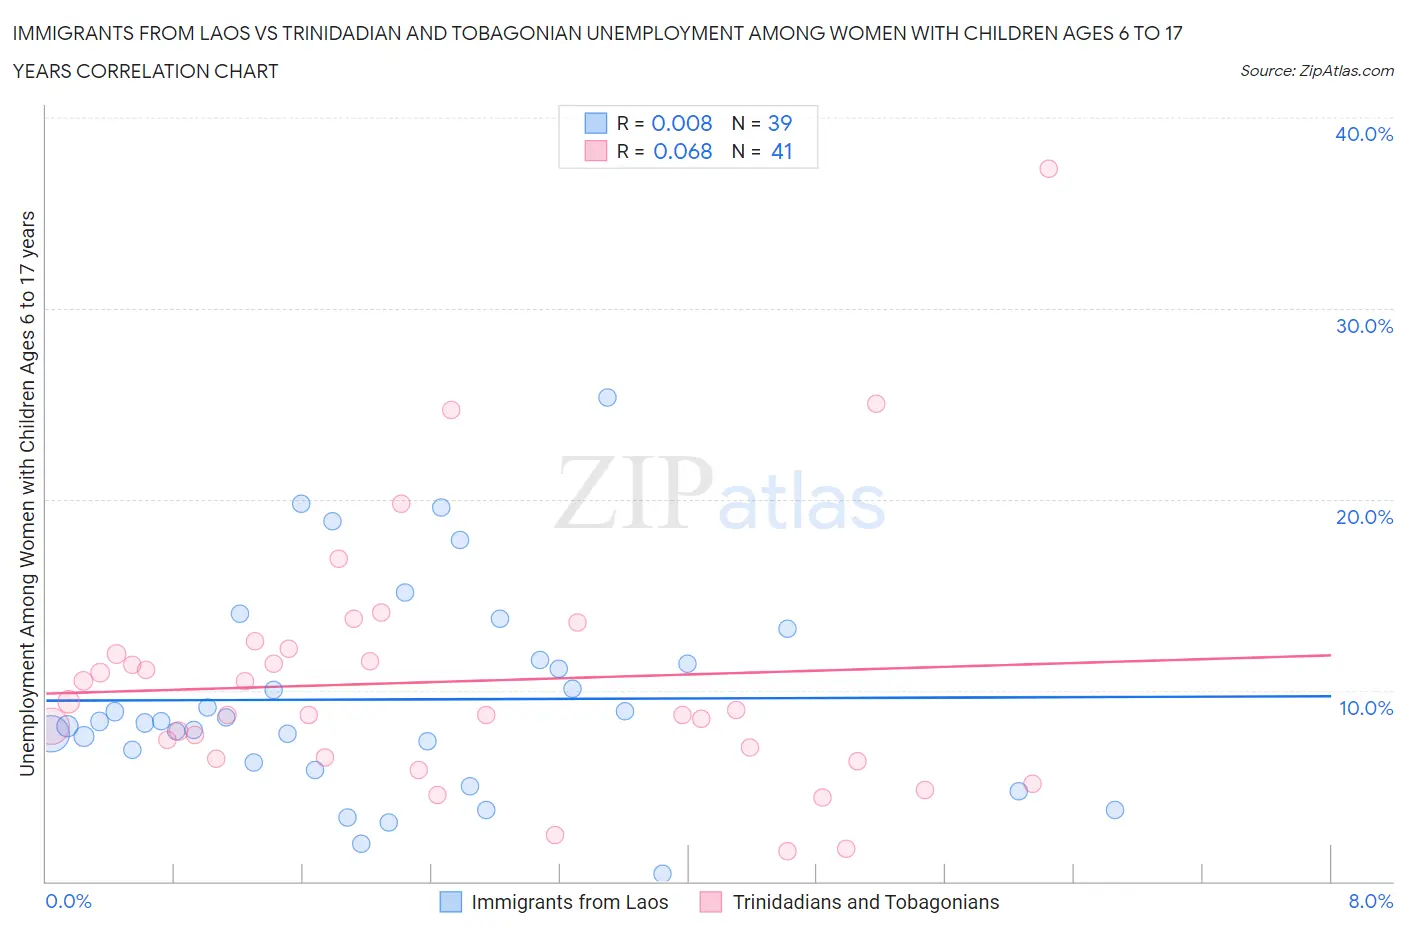
Immigrants from Laos vs Trinidadian and Tobagonian Unemployment Among Women with Children Ages 6 to 17 years Correlation Chart
The statistical analysis conducted on geographies consisting of 166,241,149 people shows no correlation between the proportion of Immigrants from Laos and unemployment rate among women with children between the ages 6 and 17 in the United States with a correlation coefficient (R) of 0.008 and weighted average of 8.2%. Similarly, the statistical analysis conducted on geographies consisting of 177,682,071 people shows a slight positive correlation between the proportion of Trinidadians and Tobagonians and unemployment rate among women with children between the ages 6 and 17 in the United States with a correlation coefficient (R) of 0.068 and weighted average of 9.1%, a difference of 11.7%.
Unemployment Among Women with Children Ages 6 to 17 years Correlation Summary
| Measurement | Immigrants from Laos | Trinidadian and Tobagonian |
| Minimum | 0.40% | 1.6% |
| Maximum | 25.3% | 37.3% |
| Range | 24.9% | 35.7% |
| Mean | 9.5% | 10.4% |
| Median | 8.4% | 8.7% |
| Interquartile 25% (IQ1) | 6.2% | 6.4% |
| Interquartile 75% (IQ3) | 11.6% | 12.0% |
| Interquartile Range (IQR) | 5.4% | 5.6% |
| Standard Deviation (Sample) | 5.4% | 6.7% |
| Standard Deviation (Population) | 5.3% | 6.6% |
Similar Demographics by Unemployment Among Women with Children Ages 6 to 17 years
Demographics Similar to Immigrants from Laos by Unemployment Among Women with Children Ages 6 to 17 years
In terms of unemployment among women with children ages 6 to 17 years, the demographic groups most similar to Immigrants from Laos are Immigrants from Bosnia and Herzegovina (8.2%, a difference of 0.020%), Immigrants from Japan (8.2%, a difference of 0.030%), Immigrants from Armenia (8.2%, a difference of 0.10%), Immigrants from Malaysia (8.2%, a difference of 0.19%), and Immigrants from Philippines (8.2%, a difference of 0.26%).
| Demographics | Rating | Rank | Unemployment Among Women with Children Ages 6 to 17 years |
| Hawaiians | 100.0 /100 | #50 | Exceptional 8.1% |
| Immigrants | Sudan | 100.0 /100 | #51 | Exceptional 8.1% |
| Immigrants | Iraq | 100.0 /100 | #52 | Exceptional 8.1% |
| Danes | 100.0 /100 | #53 | Exceptional 8.1% |
| Immigrants | Armenia | 100.0 /100 | #54 | Exceptional 8.2% |
| Immigrants | Japan | 100.0 /100 | #55 | Exceptional 8.2% |
| Immigrants | Bosnia and Herzegovina | 100.0 /100 | #56 | Exceptional 8.2% |
| Immigrants | Laos | 100.0 /100 | #57 | Exceptional 8.2% |
| Immigrants | Malaysia | 100.0 /100 | #58 | Exceptional 8.2% |
| Immigrants | Philippines | 100.0 /100 | #59 | Exceptional 8.2% |
| Basques | 100.0 /100 | #60 | Exceptional 8.2% |
| Koreans | 100.0 /100 | #61 | Exceptional 8.2% |
| Spanish American Indians | 100.0 /100 | #62 | Exceptional 8.2% |
| Immigrants | South Eastern Asia | 99.9 /100 | #63 | Exceptional 8.2% |
| Immigrants | Kuwait | 99.9 /100 | #64 | Exceptional 8.3% |
Demographics Similar to Trinidadians and Tobagonians by Unemployment Among Women with Children Ages 6 to 17 years
In terms of unemployment among women with children ages 6 to 17 years, the demographic groups most similar to Trinidadians and Tobagonians are Immigrants from Trinidad and Tobago (9.1%, a difference of 0.11%), Czechoslovakian (9.1%, a difference of 0.18%), Immigrants from Middle Africa (9.1%, a difference of 0.20%), Maltese (9.1%, a difference of 0.22%), and Immigrants from Canada (9.1%, a difference of 0.23%).
| Demographics | Rating | Rank | Unemployment Among Women with Children Ages 6 to 17 years |
| Immigrants | Turkey | 25.8 /100 | #193 | Fair 9.1% |
| Immigrants | Kazakhstan | 25.3 /100 | #194 | Fair 9.1% |
| Austrians | 25.0 /100 | #195 | Fair 9.1% |
| Brazilians | 24.4 /100 | #196 | Fair 9.1% |
| Immigrants | Panama | 24.3 /100 | #197 | Fair 9.1% |
| Guyanese | 21.8 /100 | #198 | Fair 9.1% |
| Czechoslovakians | 20.8 /100 | #199 | Fair 9.1% |
| Trinidadians and Tobagonians | 18.2 /100 | #200 | Poor 9.1% |
| Immigrants | Trinidad and Tobago | 16.7 /100 | #201 | Poor 9.1% |
| Immigrants | Middle Africa | 15.6 /100 | #202 | Poor 9.1% |
| Maltese | 15.3 /100 | #203 | Poor 9.1% |
| Immigrants | Canada | 15.3 /100 | #204 | Poor 9.1% |
| Immigrants | Western Europe | 14.1 /100 | #205 | Poor 9.1% |
| Immigrants | North America | 12.7 /100 | #206 | Poor 9.2% |
| Cubans | 10.9 /100 | #207 | Poor 9.2% |