Immigrants from Laos vs Mexican American Indian Unemployment Among Youth under 25 years
COMPARE
Immigrants from Laos
Mexican American Indian
Unemployment Among Youth under 25 years
Unemployment Among Youth under 25 years Comparison
Immigrants from Laos
Mexican American Indians
11.5%
UNEMPLOYMENT AMONG YOUTH UNDER 25 YEARS
62.4/ 100
METRIC RATING
164th/ 347
METRIC RANK
12.3%
UNEMPLOYMENT AMONG YOUTH UNDER 25 YEARS
0.4/ 100
METRIC RATING
251st/ 347
METRIC RANK
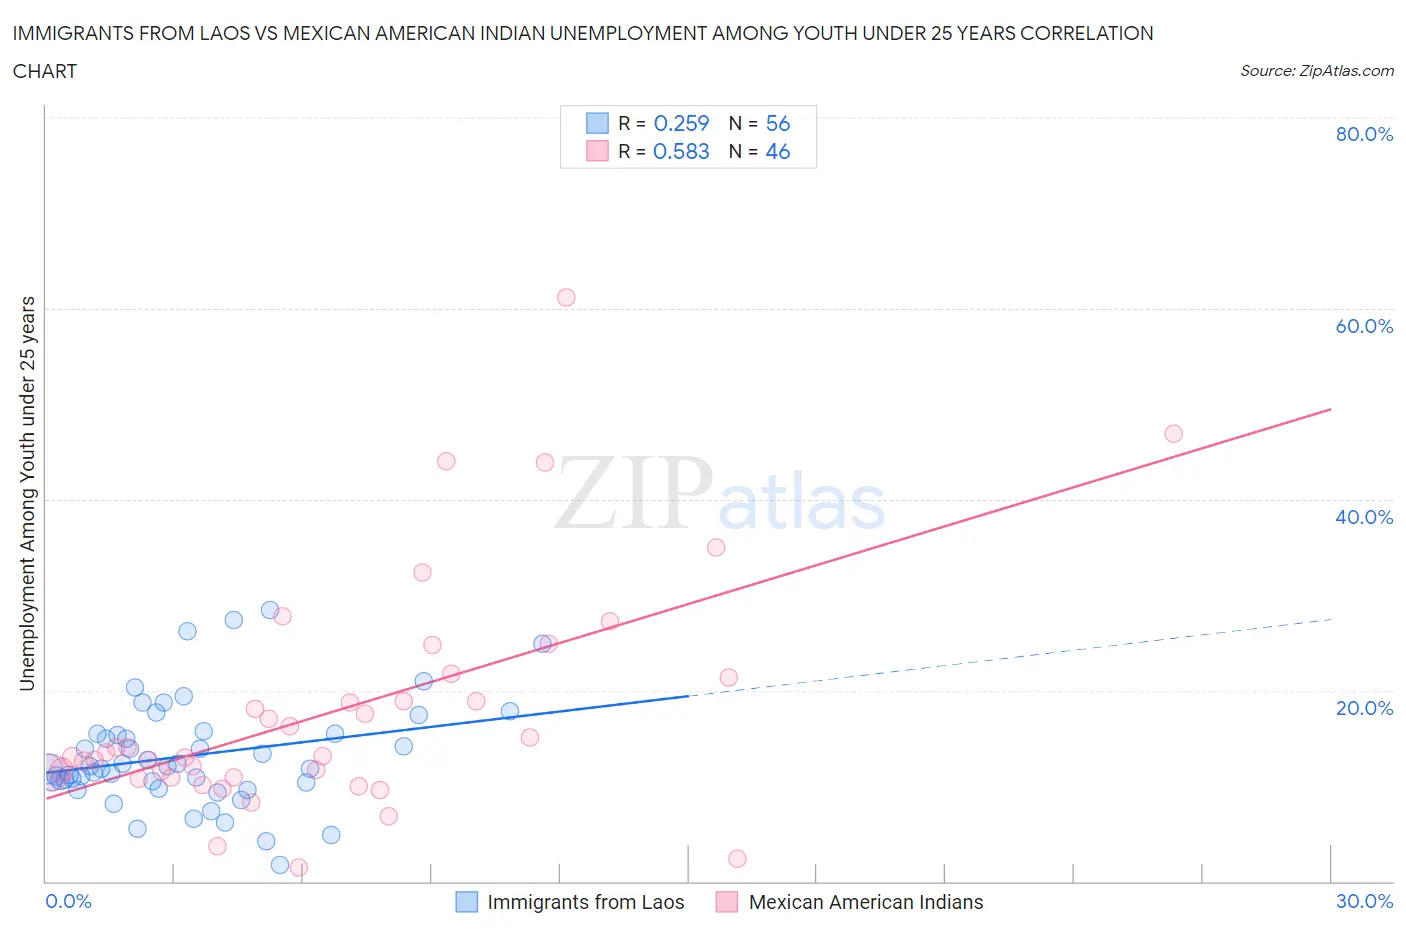
Immigrants from Laos vs Mexican American Indian Unemployment Among Youth under 25 years Correlation Chart
The statistical analysis conducted on geographies consisting of 200,437,266 people shows a weak positive correlation between the proportion of Immigrants from Laos and unemployment rate among youth under the age of 25 in the United States with a correlation coefficient (R) of 0.259 and weighted average of 11.5%. Similarly, the statistical analysis conducted on geographies consisting of 315,368,909 people shows a substantial positive correlation between the proportion of Mexican American Indians and unemployment rate among youth under the age of 25 in the United States with a correlation coefficient (R) of 0.583 and weighted average of 12.3%, a difference of 6.4%.
Unemployment Among Youth under 25 years Correlation Summary
| Measurement | Immigrants from Laos | Mexican American Indian |
| Minimum | 1.7% | 1.5% |
| Maximum | 28.4% | 61.2% |
| Range | 26.7% | 59.7% |
| Mean | 13.2% | 17.9% |
| Median | 11.9% | 13.3% |
| Interquartile 25% (IQ1) | 10.4% | 10.9% |
| Interquartile 75% (IQ3) | 15.4% | 21.3% |
| Interquartile Range (IQR) | 5.0% | 10.4% |
| Standard Deviation (Sample) | 5.5% | 12.1% |
| Standard Deviation (Population) | 5.5% | 12.0% |
Similar Demographics by Unemployment Among Youth under 25 years
Demographics Similar to Immigrants from Laos by Unemployment Among Youth under 25 years
In terms of unemployment among youth under 25 years, the demographic groups most similar to Immigrants from Laos are Immigrants from Northern Africa (11.5%, a difference of 0.010%), Immigrants from Kazakhstan (11.5%, a difference of 0.010%), Immigrants from Sweden (11.5%, a difference of 0.050%), Ukrainian (11.5%, a difference of 0.080%), and Immigrants from Eastern Asia (11.5%, a difference of 0.090%).
| Demographics | Rating | Rank | Unemployment Among Youth under 25 years |
| Indians (Asian) | 65.1 /100 | #157 | Good 11.5% |
| Immigrants | Turkey | 64.8 /100 | #158 | Good 11.5% |
| Immigrants | Western Europe | 64.7 /100 | #159 | Good 11.5% |
| Immigrants | Eastern Asia | 64.5 /100 | #160 | Good 11.5% |
| Ukrainians | 64.3 /100 | #161 | Good 11.5% |
| Immigrants | Northern Africa | 62.7 /100 | #162 | Good 11.5% |
| Immigrants | Kazakhstan | 62.7 /100 | #163 | Good 11.5% |
| Immigrants | Laos | 62.4 /100 | #164 | Good 11.5% |
| Immigrants | Sweden | 61.3 /100 | #165 | Good 11.5% |
| Spanish | 60.3 /100 | #166 | Good 11.6% |
| Okinawans | 58.7 /100 | #167 | Average 11.6% |
| Potawatomi | 57.9 /100 | #168 | Average 11.6% |
| Eastern Europeans | 57.5 /100 | #169 | Average 11.6% |
| Russians | 57.3 /100 | #170 | Average 11.6% |
| Bangladeshis | 55.6 /100 | #171 | Average 11.6% |
Demographics Similar to Mexican American Indians by Unemployment Among Youth under 25 years
In terms of unemployment among youth under 25 years, the demographic groups most similar to Mexican American Indians are Delaware (12.3%, a difference of 0.030%), Immigrants from Syria (12.3%, a difference of 0.040%), Mexican (12.3%, a difference of 0.080%), Honduran (12.3%, a difference of 0.10%), and Soviet Union (12.2%, a difference of 0.45%).
| Demographics | Rating | Rank | Unemployment Among Youth under 25 years |
| Alaskan Athabascans | 0.6 /100 | #244 | Tragic 12.2% |
| Spanish Americans | 0.6 /100 | #245 | Tragic 12.2% |
| Immigrants | Honduras | 0.6 /100 | #246 | Tragic 12.2% |
| Immigrants | Greece | 0.6 /100 | #247 | Tragic 12.2% |
| Central Americans | 0.6 /100 | #248 | Tragic 12.2% |
| Soviet Union | 0.6 /100 | #249 | Tragic 12.2% |
| Delaware | 0.4 /100 | #250 | Tragic 12.3% |
| Mexican American Indians | 0.4 /100 | #251 | Tragic 12.3% |
| Immigrants | Syria | 0.3 /100 | #252 | Tragic 12.3% |
| Mexicans | 0.3 /100 | #253 | Tragic 12.3% |
| Hondurans | 0.3 /100 | #254 | Tragic 12.3% |
| Hispanics or Latinos | 0.2 /100 | #255 | Tragic 12.4% |
| Liberians | 0.2 /100 | #256 | Tragic 12.4% |
| Panamanians | 0.2 /100 | #257 | Tragic 12.4% |
| Salvadorans | 0.1 /100 | #258 | Tragic 12.4% |