Immigrants from Laos vs Immigrants from Iraq Unemployment Among Youth under 25 years
COMPARE
Immigrants from Laos
Immigrants from Iraq
Unemployment Among Youth under 25 years
Unemployment Among Youth under 25 years Comparison
Immigrants from Laos
Immigrants from Iraq
11.5%
UNEMPLOYMENT AMONG YOUTH UNDER 25 YEARS
62.4/ 100
METRIC RATING
164th/ 347
METRIC RANK
11.6%
UNEMPLOYMENT AMONG YOUTH UNDER 25 YEARS
47.0/ 100
METRIC RATING
175th/ 347
METRIC RANK
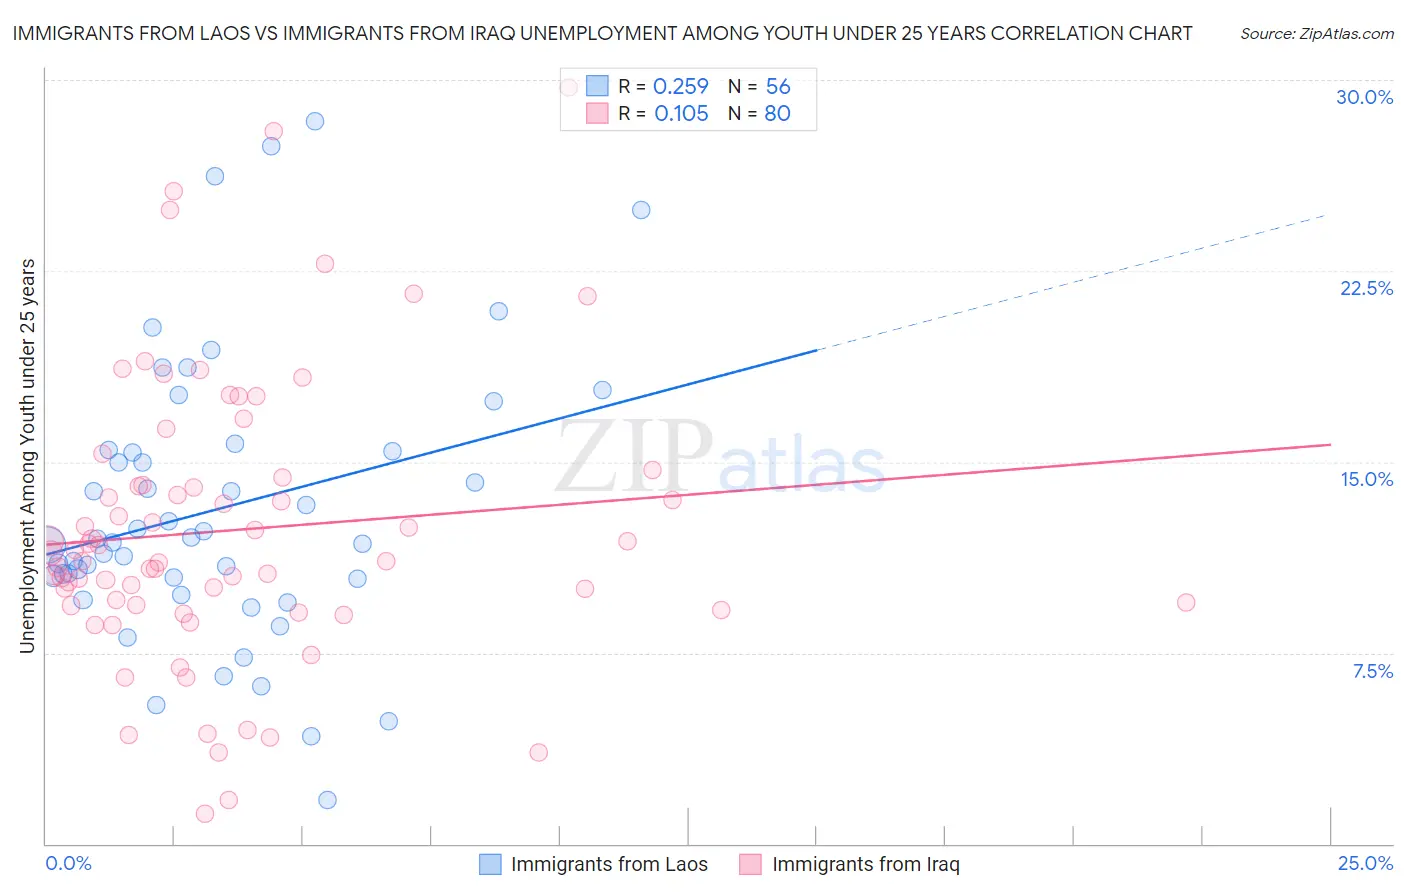
Immigrants from Laos vs Immigrants from Iraq Unemployment Among Youth under 25 years Correlation Chart
The statistical analysis conducted on geographies consisting of 200,437,266 people shows a weak positive correlation between the proportion of Immigrants from Laos and unemployment rate among youth under the age of 25 in the United States with a correlation coefficient (R) of 0.259 and weighted average of 11.5%. Similarly, the statistical analysis conducted on geographies consisting of 194,003,673 people shows a poor positive correlation between the proportion of Immigrants from Iraq and unemployment rate among youth under the age of 25 in the United States with a correlation coefficient (R) of 0.105 and weighted average of 11.6%, a difference of 0.65%.
Unemployment Among Youth under 25 years Correlation Summary
| Measurement | Immigrants from Laos | Immigrants from Iraq |
| Minimum | 1.7% | 1.2% |
| Maximum | 28.4% | 29.7% |
| Range | 26.7% | 28.5% |
| Mean | 13.2% | 12.3% |
| Median | 11.9% | 11.3% |
| Interquartile 25% (IQ1) | 10.4% | 9.4% |
| Interquartile 75% (IQ3) | 15.4% | 14.2% |
| Interquartile Range (IQR) | 5.0% | 4.9% |
| Standard Deviation (Sample) | 5.5% | 5.6% |
| Standard Deviation (Population) | 5.5% | 5.5% |
Demographics Similar to Immigrants from Laos and Immigrants from Iraq by Unemployment Among Youth under 25 years
In terms of unemployment among youth under 25 years, the demographic groups most similar to Immigrants from Laos are Immigrants from Northern Africa (11.5%, a difference of 0.010%), Immigrants from Kazakhstan (11.5%, a difference of 0.010%), Immigrants from Sweden (11.5%, a difference of 0.050%), Ukrainian (11.5%, a difference of 0.080%), and Immigrants from Eastern Asia (11.5%, a difference of 0.090%). Similarly, the demographic groups most similar to Immigrants from Iraq are Ugandan (11.6%, a difference of 0.060%), Immigrants from Denmark (11.6%, a difference of 0.090%), Immigrants from China (11.6%, a difference of 0.12%), Immigrants from South Eastern Asia (11.6%, a difference of 0.19%), and Immigrants from Europe (11.6%, a difference of 0.19%).
| Demographics | Rating | Rank | Unemployment Among Youth under 25 years |
| Immigrants | Western Europe | 64.7 /100 | #159 | Good 11.5% |
| Immigrants | Eastern Asia | 64.5 /100 | #160 | Good 11.5% |
| Ukrainians | 64.3 /100 | #161 | Good 11.5% |
| Immigrants | Northern Africa | 62.7 /100 | #162 | Good 11.5% |
| Immigrants | Kazakhstan | 62.7 /100 | #163 | Good 11.5% |
| Immigrants | Laos | 62.4 /100 | #164 | Good 11.5% |
| Immigrants | Sweden | 61.3 /100 | #165 | Good 11.5% |
| Spanish | 60.3 /100 | #166 | Good 11.6% |
| Okinawans | 58.7 /100 | #167 | Average 11.6% |
| Potawatomi | 57.9 /100 | #168 | Average 11.6% |
| Eastern Europeans | 57.5 /100 | #169 | Average 11.6% |
| Russians | 57.3 /100 | #170 | Average 11.6% |
| Bangladeshis | 55.6 /100 | #171 | Average 11.6% |
| Immigrants | Morocco | 55.1 /100 | #172 | Average 11.6% |
| Immigrants | South Eastern Asia | 51.7 /100 | #173 | Average 11.6% |
| Immigrants | China | 50.0 /100 | #174 | Average 11.6% |
| Immigrants | Iraq | 47.0 /100 | #175 | Average 11.6% |
| Ugandans | 45.6 /100 | #176 | Average 11.6% |
| Immigrants | Denmark | 45.0 /100 | #177 | Average 11.6% |
| Immigrants | Europe | 42.4 /100 | #178 | Average 11.6% |
| Immigrants | Hong Kong | 42.4 /100 | #179 | Average 11.6% |