Immigrants from Japan vs Senegalese Unemployment Among Ages 20 to 24 years

COMPARE

Immigrants from Japan
Race
Ancestry
AfghanAfricanAlaska NativeAlaskan AthabascanAlbanianAleutAlsatianAmericanApacheArabArapahoArgentineanArmenianAssyrian/Chaldean/SyriacAustralianAustrianBahamianBangladeshiBarbadianBasqueBelgianBelizeanBermudanBhutaneseBlackfeetBolivianBrazilianBritishBritish West IndianBulgarianBurmeseCajunCambodianCanadianCape VerdeanCarpatho RusynCelticCentral AmericanCentral American IndianCherokeeCheyenneChickasawChileanChineseChippewaChoctawColombianColvilleComancheCosta RicanCreeCreekCroatianCrowCubanCypriotCzechCzechoslovakianDanishDelawareDominicanDutchDutch West IndianEastern EuropeanEcuadorianEgyptianEnglishEstonianEthiopianEuropeanFijianFilipinoFinnishFrenchFrench American IndianFrench CanadianGermanGerman RussianGhanaianGreekGuamanian/ChamorroGuatemalanGuyaneseHaitianHmongHonduranHopiHoumaHungarianIcelanderIndian (Asian)IndonesianInupiatIranianIraqiIrishIroquoisIsraeliItalianJamaicanJapaneseJordanianKenyanKiowaKoreanLaotianLatvianLebaneseLiberianLithuanianLumbeeLuxembourgerMacedonianMalaysianMalteseMarshalleseMenomineeMexicanMexican American IndianMongolianMoroccanNative HawaiianNavajoNepaleseNew ZealanderNicaraguanNigerianNorthern EuropeanNorwegianOkinawanOsageOttawaPaiutePakistaniPalestinianPanamanianParaguayanPennsylvania GermanPeruvianPimaPolishPortuguesePotawatomiPuebloPuerto RicanPuget Sound SalishRomanianRussianSalvadoranSamoanScandinavianScotch-IrishScottishSeminoleSerbianShoshoneSierra LeoneanSiouxSlavicSlovakSloveneSomaliSouth AfricanSouth AmericanSouth American IndianSoviet UnionSpaniardSpanishSpanish AmericanSpanish American IndianSri LankanSubsaharan AfricanSudaneseSwedishSwissSyrianTaiwaneseThaiTlingit-HaidaTohono O'OdhamTonganTrinidadian and TobagonianTsimshianTurkishU.S. Virgin IslanderUgandanUkrainianUruguayanUteVenezuelanVietnameseWelshWest IndianYakamaYaquiYugoslavianYumanYup'ikZimbabwean
Immigration
NonimmigrantsImmigrantsAfghanistanAfricaAlbaniaArgentinaArmeniaAsiaAustraliaAustriaBahamasBangladeshBarbadosBelarusBelgiumBelizeBoliviaBosnia and HerzegovinaBrazilBulgariaBurma/MyanmarCabo VerdeCambodiaCameroonCanadaCaribbeanCentral AmericaChileChinaColombiaCongoCosta RicaCroatiaCubaCzechoslovakiaDenmarkDominicaDominican RepublicEastern AfricaEastern AsiaEastern EuropeEcuadorEgyptEl SalvadorEnglandEritreaEthiopiaEuropeFijiFranceGermanyGhanaGreeceGrenadaGuatemalaGuyanaHaitiHondurasHong KongHungaryIndiaIndonesiaIranIraqIrelandIsraelItalyJamaicaJapanJordanKazakhstanKenyaKoreaKuwaitLaosLatin AmericaLatviaLebanonLiberiaLithuaniaMalaysiaMexicoMicronesiaMiddle AfricaMoldovaMoroccoNepalNetherlandsNicaraguaNigeriaNorth AmericaNorth MacedoniaNorthern AfricaNorthern EuropeNorwayOceaniaPakistanPanamaPeruPhilippinesPolandPortugalRomaniaRussiaSaudi ArabiaScotlandSenegalSerbiaSierra LeoneSingaporeSomaliaSouth AfricaSouth AmericaSouth Central AsiaSouth Eastern AsiaSouthern EuropeSpainSri LankaSt. Vincent and the GrenadinesSudanSwedenSwitzerlandSyriaTaiwanThailandTrinidad and TobagoTurkeyUgandaUkraineUruguayUzbekistanVenezuelaVietnamWest IndiesWestern AfricaWestern AsiaWestern EuropeYemenZaireZimbabweAzores
Senegalese
Race
Ancestry
AfghanAfricanAlaska NativeAlaskan AthabascanAlbanianAleutAlsatianAmericanApacheArabArapahoArgentineanArmenianAssyrian/Chaldean/SyriacAustralianAustrianBahamianBangladeshiBarbadianBasqueBelgianBelizeanBermudanBhutaneseBlackfeetBolivianBrazilianBritishBritish West IndianBulgarianBurmeseCajunCambodianCanadianCape VerdeanCarpatho RusynCelticCentral AmericanCentral American IndianCherokeeCheyenneChickasawChileanChineseChippewaChoctawColombianColvilleComancheCosta RicanCreeCreekCroatianCrowCubanCypriotCzechCzechoslovakianDanishDelawareDominicanDutchDutch West IndianEastern EuropeanEcuadorianEgyptianEnglishEstonianEthiopianEuropeanFijianFilipinoFinnishFrenchFrench American IndianFrench CanadianGermanGerman RussianGhanaianGreekGuamanian/ChamorroGuatemalanGuyaneseHaitianHmongHonduranHopiHoumaHungarianIcelanderIndian (Asian)IndonesianInupiatIranianIraqiIrishIroquoisIsraeliItalianJamaicanJapaneseJordanianKenyanKiowaKoreanLaotianLatvianLebaneseLiberianLithuanianLumbeeLuxembourgerMacedonianMalaysianMalteseMarshalleseMenomineeMexicanMexican American IndianMongolianMoroccanNative HawaiianNavajoNepaleseNew ZealanderNicaraguanNigerianNorthern EuropeanNorwegianOkinawanOsageOttawaPaiutePakistaniPalestinianPanamanianParaguayanPennsylvania GermanPeruvianPimaPolishPortuguesePotawatomiPuebloPuerto RicanPuget Sound SalishRomanianRussianSalvadoranSamoanScandinavianScotch-IrishScottishSeminoleSenegaleseSerbianShoshoneSierra LeoneanSiouxSlavicSlovakSloveneSomaliSouth AfricanSouth AmericanSouth American IndianSoviet UnionSpaniardSpanishSpanish AmericanSpanish American IndianSri LankanSubsaharan AfricanSudaneseSwedishSwissSyrianTaiwaneseThaiTlingit-HaidaTohono O'OdhamTonganTrinidadian and TobagonianTsimshianTurkishU.S. Virgin IslanderUgandanUkrainianUruguayanUteVenezuelanVietnameseWelshWest IndianYakamaYaquiYugoslavianYumanYup'ikZimbabwean
Immigration
NonimmigrantsImmigrantsAfghanistanAfricaAlbaniaArgentinaArmeniaAsiaAustraliaAustriaBahamasBangladeshBarbadosBelarusBelgiumBelizeBoliviaBosnia and HerzegovinaBrazilBulgariaBurma/MyanmarCabo VerdeCambodiaCameroonCanadaCaribbeanCentral AmericaChileChinaColombiaCongoCosta RicaCroatiaCubaCzechoslovakiaDenmarkDominicaDominican RepublicEastern AfricaEastern AsiaEastern EuropeEcuadorEgyptEl SalvadorEnglandEritreaEthiopiaEuropeFijiFranceGermanyGhanaGreeceGrenadaGuatemalaGuyanaHaitiHondurasHong KongHungaryIndiaIndonesiaIranIraqIrelandIsraelItalyJamaicaJordanKazakhstanKenyaKoreaKuwaitLaosLatin AmericaLatviaLebanonLiberiaLithuaniaMalaysiaMexicoMicronesiaMiddle AfricaMoldovaMoroccoNepalNetherlandsNicaraguaNigeriaNorth AmericaNorth MacedoniaNorthern AfricaNorthern EuropeNorwayOceaniaPakistanPanamaPeruPhilippinesPolandPortugalRomaniaRussiaSaudi ArabiaScotlandSenegalSerbiaSierra LeoneSingaporeSomaliaSouth AfricaSouth AmericaSouth Central AsiaSouth Eastern AsiaSouthern EuropeSpainSri LankaSt. Vincent and the GrenadinesSudanSwedenSwitzerlandSyriaTaiwanThailandTrinidad and TobagoTurkeyUgandaUkraineUruguayUzbekistanVenezuelaVietnamWest IndiesWestern AfricaWestern AsiaWestern EuropeYemenZaireZimbabweAzores
Unemployment Among Ages 20 to 24 years
Income
Poverty
Unemployment
Labor Participation
Family Structure
Vehicle Availability
Education Level
Disability

Unemployment Among Ages 20 to 24 years Comparison

Immigrants from Japan

Senegalese

Excellent
Tragic
10.1%
UNEMPLOYMENT AMONG AGES 20 TO 24 YEARS
86.5/ 100
METRIC RATING
124th/ 347
METRIC RANK
11.5%
UNEMPLOYMENT AMONG AGES 20 TO 24 YEARS
0.0/ 100
METRIC RATING
275th/ 347
METRIC RANK

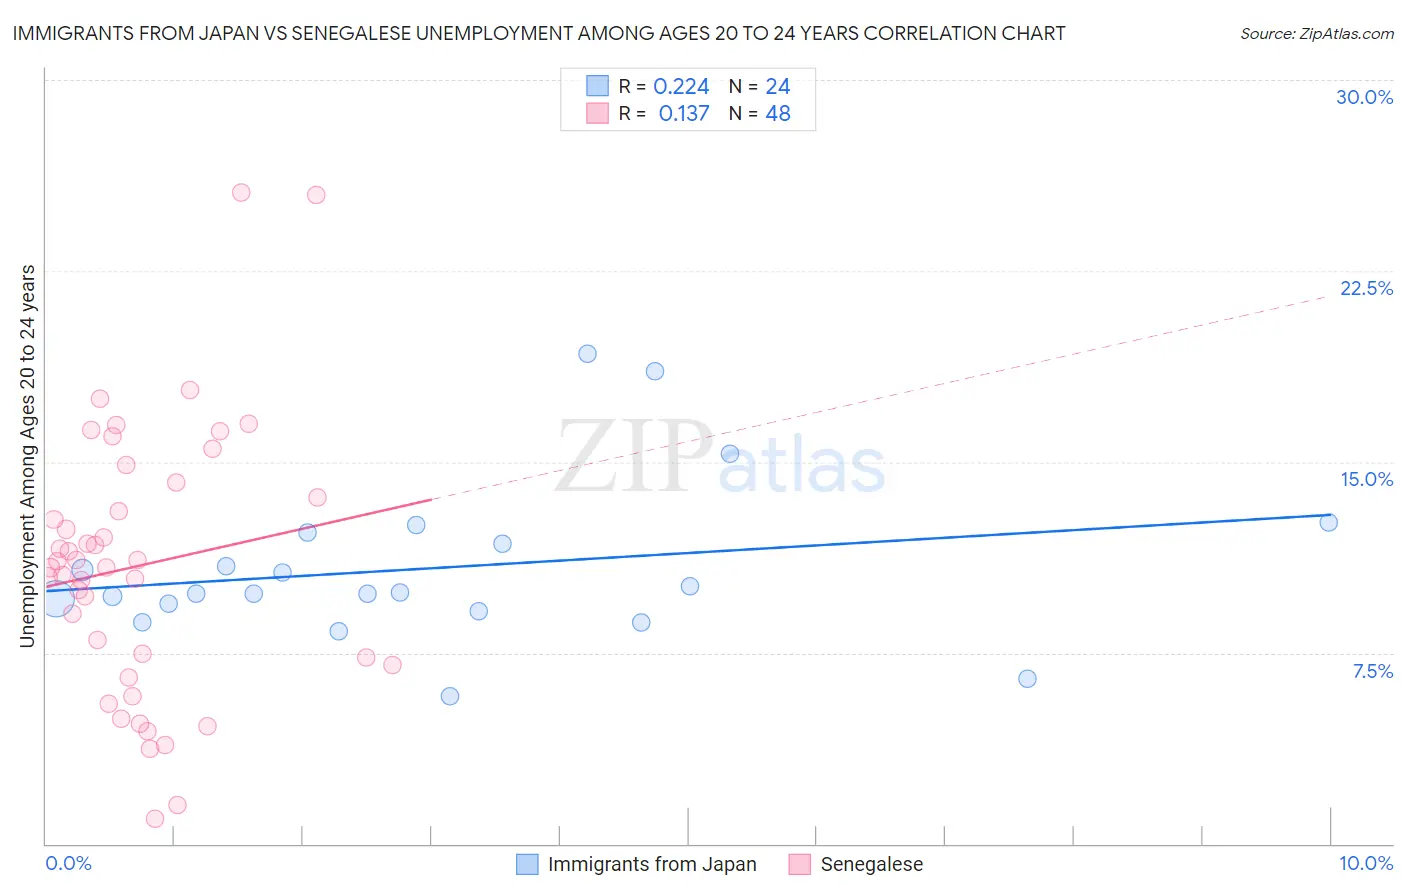
Immigrants from Japan vs Senegalese Unemployment Among Ages 20 to 24 years Correlation Chart

The statistical analysis conducted on geographies consisting of 332,545,610 people shows a weak positive correlation between the proportion of Immigrants from Japan and unemployment rate among population between the ages 20 and 24 in the United States with a correlation coefficient (R) of 0.224 and weighted average of 10.1%. Similarly, the statistical analysis conducted on geographies consisting of 77,937,543 people shows a poor positive correlation between the proportion of Senegalese and unemployment rate among population between the ages 20 and 24 in the United States with a correlation coefficient (R) of 0.137 and weighted average of 11.5%, a difference of 13.8%.
Immigrants from Japan vs Senegalese Unemployment Among Ages 20 to 24 years

Unemployment Among Ages 20 to 24 years Correlation Summary

MeasurementImmigrants from JapanSenegalese
Minimum5.8%1.0%
Maximum19.2%25.6%
Range13.5%24.6%
Mean10.8%10.9%
Median9.8%11.0%
Interquartile 25% (IQ1)9.3%7.2%
Interquartile 75% (IQ3)12.0%13.9%
Interquartile Range (IQR)2.7%6.8%
Standard Deviation (Sample)3.2%5.3%
Standard Deviation (Population)3.1%5.2%

Similar Demographics by Unemployment Among Ages 20 to 24 years

Demographics Similar to Immigrants from Japan by Unemployment Among Ages 20 to 24 years

In terms of unemployment among ages 20 to 24 years, the demographic groups most similar to Immigrants from Japan are Spanish (10.1%, a difference of 0.030%), Jordanian (10.1%, a difference of 0.030%), Immigrants from Iraq (10.1%, a difference of 0.050%), White/Caucasian (10.1%, a difference of 0.070%), and Immigrants from Norway (10.1%, a difference of 0.090%).
DemographicsRating | RankUnemployment Among Ages 20 to 24 years
Immigrants | Uruguay
89.6
/100
|
#117
Excellent
10.1%
Paraguayans
88.6
/100
|
#118
Excellent
10.1%
French
88.2
/100
|
#119
Excellent
10.1%
Immigrants | Canada
88.2
/100
|
#120
Excellent
10.1%
South Africans
87.8
/100
|
#121
Excellent
10.1%
Whites/Caucasians
87.4
/100
|
#122
Excellent
10.1%
Immigrants | Iraq
87.1
/100
|
#123
Excellent
10.1%
Immigrants | Japan
86.5
/100
|
#124
Excellent
10.1%
Spanish
86.1
/100
|
#125
Excellent
10.1%
Jordanians
86.1
/100
|
#126
Excellent
10.1%
Immigrants | Norway
85.3
/100
|
#127
Excellent
10.1%
Immigrants | Brazil
84.9
/100
|
#128
Excellent
10.1%
Immigrants | South Central Asia
84.6
/100
|
#129
Excellent
10.1%
Immigrants | Lithuania
84.2
/100
|
#130
Excellent
10.1%
Seminole
84.2
/100
|
#131
Excellent
10.1%

Demographics Similar to Senegalese by Unemployment Among Ages 20 to 24 years

In terms of unemployment among ages 20 to 24 years, the demographic groups most similar to Senegalese are Sierra Leonean (11.5%, a difference of 0.040%), African (11.5%, a difference of 0.19%), Colville (11.6%, a difference of 0.22%), Cape Verdean (11.5%, a difference of 0.36%), and Immigrants from Nigeria (11.5%, a difference of 0.44%).
DemographicsRating | RankUnemployment Among Ages 20 to 24 years
Maltese
0.0
/100
|
#268
Tragic
11.2%
Ute
0.0
/100
|
#269
Tragic
11.2%
Delaware
0.0
/100
|
#270
Tragic
11.3%
Immigrants | Uzbekistan
0.0
/100
|
#271
Tragic
11.4%
Nigerians
0.0
/100
|
#272
Tragic
11.4%
Immigrants | Nigeria
0.0
/100
|
#273
Tragic
11.5%
Cape Verdeans
0.0
/100
|
#274
Tragic
11.5%
Senegalese
0.0
/100
|
#275
Tragic
11.5%
Sierra Leoneans
0.0
/100
|
#276
Tragic
11.5%
Africans
0.0
/100
|
#277
Tragic
11.5%
Colville
0.0
/100
|
#278
Tragic
11.6%
Bahamians
0.0
/100
|
#279
Tragic
11.6%
Alaskan Athabascans
0.0
/100
|
#280
Tragic
11.6%
Armenians
0.0
/100
|
#281
Tragic
11.7%
Immigrants | Cameroon
0.0
/100
|
#282
Tragic
11.7%