Immigrants from Japan vs French Canadian Unemployment Among Ages 20 to 24 years
COMPARE
Immigrants from Japan
French Canadian
Unemployment Among Ages 20 to 24 years
Unemployment Among Ages 20 to 24 years Comparison
Immigrants from Japan
French Canadians
10.1%
UNEMPLOYMENT AMONG AGES 20 TO 24 YEARS
86.5/ 100
METRIC RATING
124th/ 347
METRIC RANK
10.2%
UNEMPLOYMENT AMONG AGES 20 TO 24 YEARS
77.5/ 100
METRIC RATING
147th/ 347
METRIC RANK
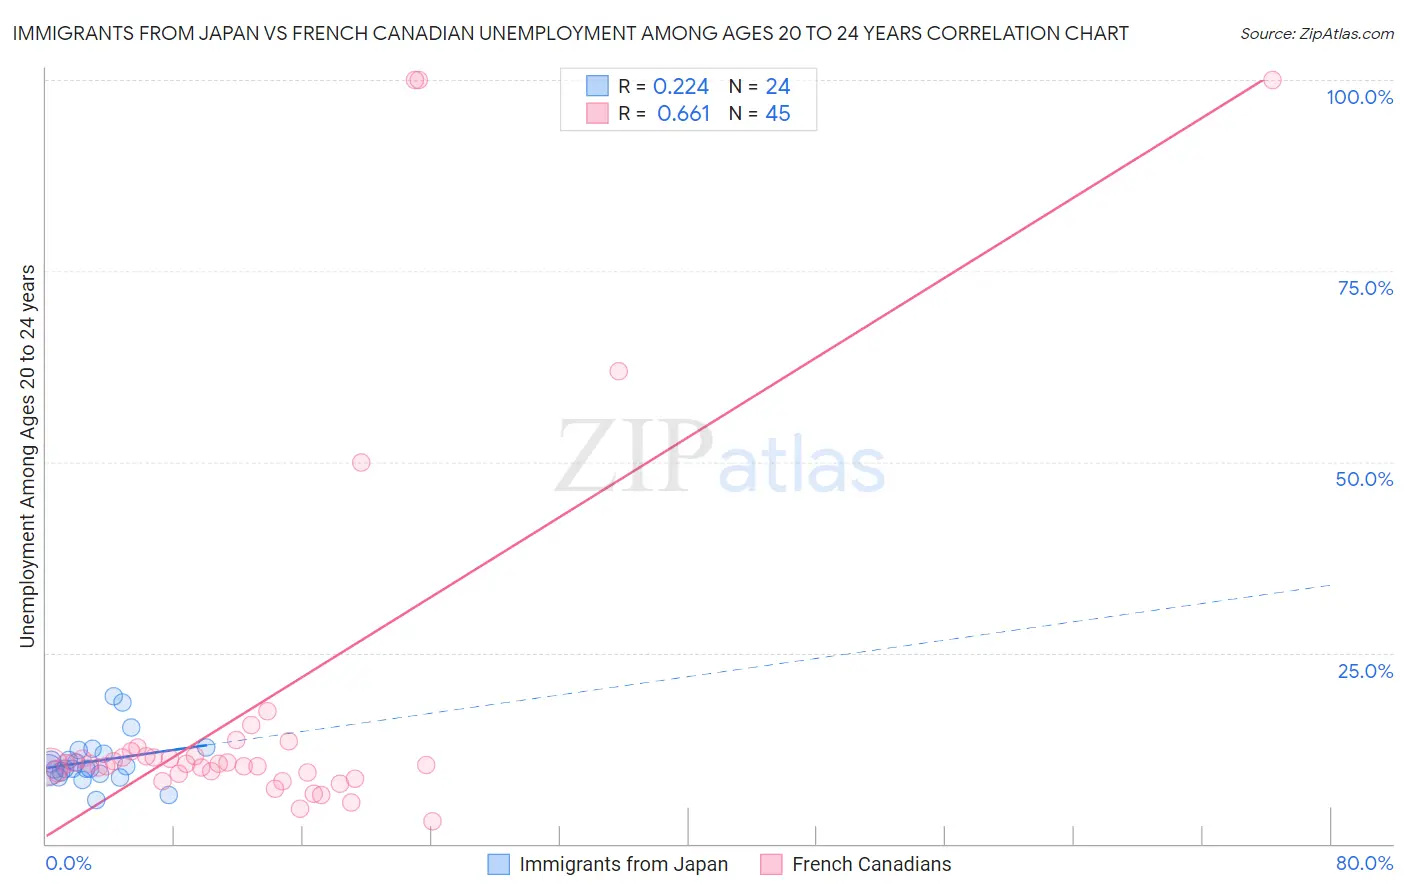
Immigrants from Japan vs French Canadian Unemployment Among Ages 20 to 24 years Correlation Chart
The statistical analysis conducted on geographies consisting of 332,545,610 people shows a weak positive correlation between the proportion of Immigrants from Japan and unemployment rate among population between the ages 20 and 24 in the United States with a correlation coefficient (R) of 0.224 and weighted average of 10.1%. Similarly, the statistical analysis conducted on geographies consisting of 471,883,331 people shows a significant positive correlation between the proportion of French Canadians and unemployment rate among population between the ages 20 and 24 in the United States with a correlation coefficient (R) of 0.661 and weighted average of 10.2%, a difference of 0.58%.
Unemployment Among Ages 20 to 24 years Correlation Summary
| Measurement | Immigrants from Japan | French Canadian |
| Minimum | 5.8% | 3.0% |
| Maximum | 19.2% | 100.0% |
| Range | 13.5% | 97.0% |
| Mean | 10.8% | 18.1% |
| Median | 9.8% | 10.4% |
| Interquartile 25% (IQ1) | 9.3% | 9.3% |
| Interquartile 75% (IQ3) | 12.0% | 11.8% |
| Interquartile Range (IQR) | 2.7% | 2.5% |
| Standard Deviation (Sample) | 3.2% | 24.3% |
| Standard Deviation (Population) | 3.1% | 24.0% |
Similar Demographics by Unemployment Among Ages 20 to 24 years
Demographics Similar to Immigrants from Japan by Unemployment Among Ages 20 to 24 years
In terms of unemployment among ages 20 to 24 years, the demographic groups most similar to Immigrants from Japan are Spanish (10.1%, a difference of 0.030%), Jordanian (10.1%, a difference of 0.030%), Immigrants from Iraq (10.1%, a difference of 0.050%), White/Caucasian (10.1%, a difference of 0.070%), and Immigrants from Norway (10.1%, a difference of 0.090%).
| Demographics | Rating | Rank | Unemployment Among Ages 20 to 24 years |
| Immigrants | Uruguay | 89.6 /100 | #117 | Excellent 10.1% |
| Paraguayans | 88.6 /100 | #118 | Excellent 10.1% |
| French | 88.2 /100 | #119 | Excellent 10.1% |
| Immigrants | Canada | 88.2 /100 | #120 | Excellent 10.1% |
| South Africans | 87.8 /100 | #121 | Excellent 10.1% |
| Whites/Caucasians | 87.4 /100 | #122 | Excellent 10.1% |
| Immigrants | Iraq | 87.1 /100 | #123 | Excellent 10.1% |
| Immigrants | Japan | 86.5 /100 | #124 | Excellent 10.1% |
| Spanish | 86.1 /100 | #125 | Excellent 10.1% |
| Jordanians | 86.1 /100 | #126 | Excellent 10.1% |
| Immigrants | Norway | 85.3 /100 | #127 | Excellent 10.1% |
| Immigrants | Brazil | 84.9 /100 | #128 | Excellent 10.1% |
| Immigrants | South Central Asia | 84.6 /100 | #129 | Excellent 10.1% |
| Immigrants | Lithuania | 84.2 /100 | #130 | Excellent 10.1% |
| Seminole | 84.2 /100 | #131 | Excellent 10.1% |
Demographics Similar to French Canadians by Unemployment Among Ages 20 to 24 years
In terms of unemployment among ages 20 to 24 years, the demographic groups most similar to French Canadians are Asian (10.2%, a difference of 0.010%), Argentinean (10.2%, a difference of 0.030%), Brazilian (10.2%, a difference of 0.040%), Immigrants from Jordan (10.2%, a difference of 0.080%), and Immigrants from Romania (10.2%, a difference of 0.090%).
| Demographics | Rating | Rank | Unemployment Among Ages 20 to 24 years |
| Immigrants | Austria | 81.4 /100 | #140 | Excellent 10.2% |
| Immigrants | Azores | 81.4 /100 | #141 | Excellent 10.2% |
| Slovaks | 80.2 /100 | #142 | Excellent 10.2% |
| Immigrants | Jordan | 79.0 /100 | #143 | Good 10.2% |
| Brazilians | 78.4 /100 | #144 | Good 10.2% |
| Argentineans | 78.0 /100 | #145 | Good 10.2% |
| Asians | 77.7 /100 | #146 | Good 10.2% |
| French Canadians | 77.5 /100 | #147 | Good 10.2% |
| Immigrants | Romania | 75.7 /100 | #148 | Good 10.2% |
| Immigrants | Scotland | 74.6 /100 | #149 | Good 10.2% |
| Hungarians | 74.4 /100 | #150 | Good 10.2% |
| Immigrants | South Africa | 73.6 /100 | #151 | Good 10.2% |
| Iranians | 72.4 /100 | #152 | Good 10.2% |
| Immigrants | Taiwan | 71.4 /100 | #153 | Good 10.2% |
| Immigrants | Switzerland | 71.3 /100 | #154 | Good 10.2% |