Immigrants from Jamaica vs Immigrants from Ethiopia Unemployment Among Ages 20 to 24 years
COMPARE
Immigrants from Jamaica
Immigrants from Ethiopia
Unemployment Among Ages 20 to 24 years
Unemployment Among Ages 20 to 24 years Comparison
Immigrants from Jamaica
Immigrants from Ethiopia
13.0%
UNEMPLOYMENT AMONG AGES 20 TO 24 YEARS
0.0/ 100
METRIC RATING
321st/ 347
METRIC RANK
9.6%
UNEMPLOYMENT AMONG AGES 20 TO 24 YEARS
99.9/ 100
METRIC RATING
40th/ 347
METRIC RANK
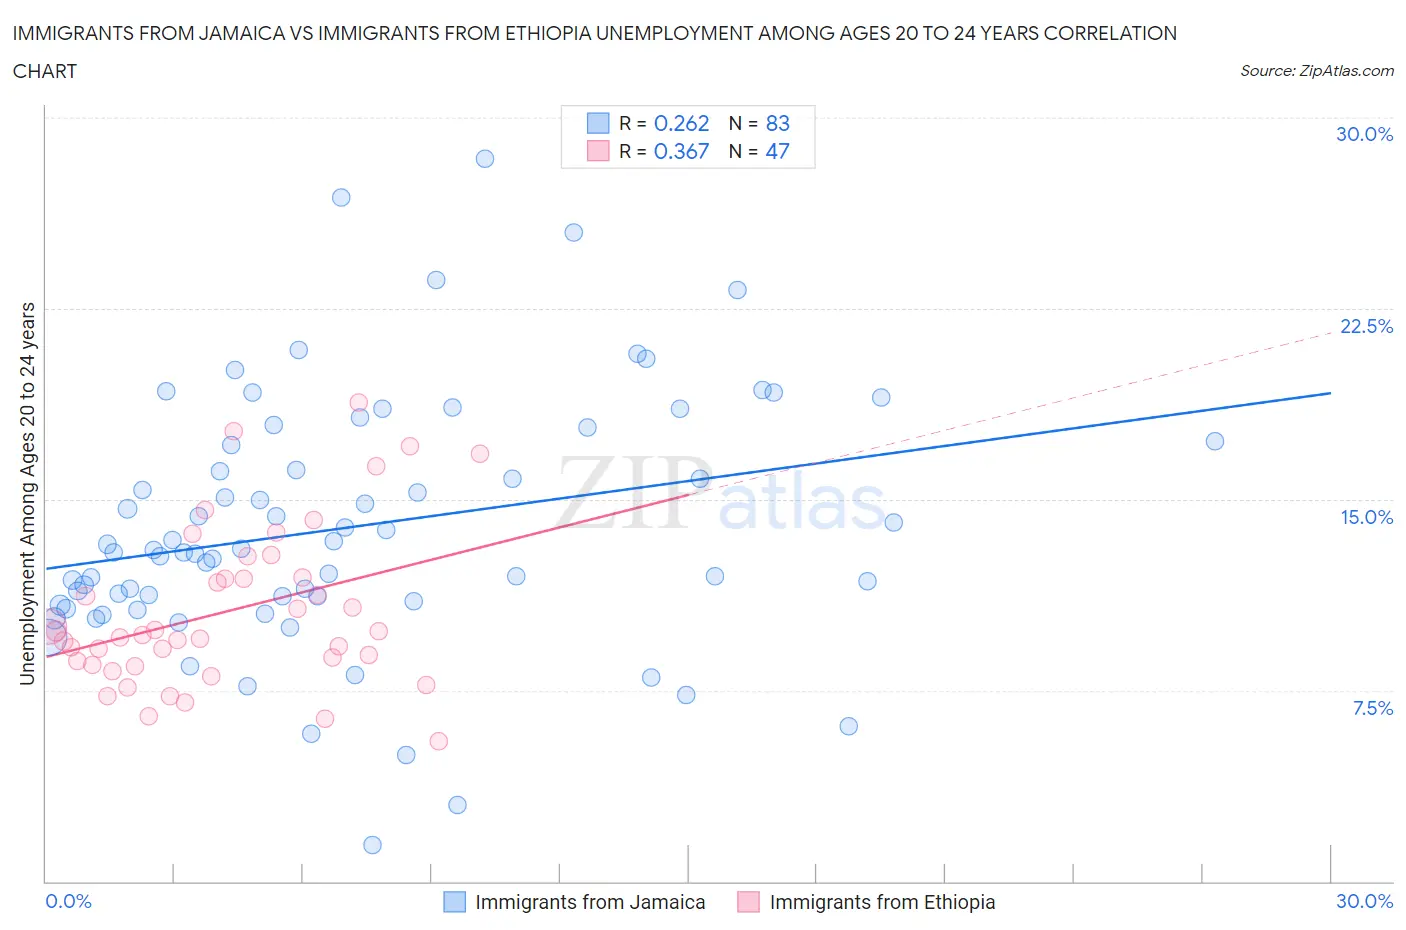
Immigrants from Jamaica vs Immigrants from Ethiopia Unemployment Among Ages 20 to 24 years Correlation Chart
The statistical analysis conducted on geographies consisting of 295,465,430 people shows a weak positive correlation between the proportion of Immigrants from Jamaica and unemployment rate among population between the ages 20 and 24 in the United States with a correlation coefficient (R) of 0.262 and weighted average of 13.0%. Similarly, the statistical analysis conducted on geographies consisting of 209,163,502 people shows a mild positive correlation between the proportion of Immigrants from Ethiopia and unemployment rate among population between the ages 20 and 24 in the United States with a correlation coefficient (R) of 0.367 and weighted average of 9.6%, a difference of 34.8%.
Unemployment Among Ages 20 to 24 years Correlation Summary
| Measurement | Immigrants from Jamaica | Immigrants from Ethiopia |
| Minimum | 1.4% | 5.5% |
| Maximum | 28.4% | 18.8% |
| Range | 27.0% | 13.3% |
| Mean | 13.9% | 10.6% |
| Median | 13.0% | 9.7% |
| Interquartile 25% (IQ1) | 11.0% | 8.5% |
| Interquartile 75% (IQ3) | 17.3% | 11.9% |
| Interquartile Range (IQR) | 6.3% | 3.4% |
| Standard Deviation (Sample) | 5.0% | 3.1% |
| Standard Deviation (Population) | 5.0% | 3.1% |
Similar Demographics by Unemployment Among Ages 20 to 24 years
Demographics Similar to Immigrants from Jamaica by Unemployment Among Ages 20 to 24 years
In terms of unemployment among ages 20 to 24 years, the demographic groups most similar to Immigrants from Jamaica are Cheyenne (13.0%, a difference of 0.080%), Native/Alaskan (13.0%, a difference of 0.38%), Trinidadian and Tobagonian (12.9%, a difference of 0.51%), Barbadian (12.9%, a difference of 0.76%), and Yakama (13.1%, a difference of 0.86%).
| Demographics | Rating | Rank | Unemployment Among Ages 20 to 24 years |
| Blacks/African Americans | 0.0 /100 | #314 | Tragic 12.7% |
| West Indians | 0.0 /100 | #315 | Tragic 12.8% |
| Immigrants | Dominica | 0.0 /100 | #316 | Tragic 12.8% |
| Immigrants | Trinidad and Tobago | 0.0 /100 | #317 | Tragic 12.8% |
| Barbadians | 0.0 /100 | #318 | Tragic 12.9% |
| Trinidadians and Tobagonians | 0.0 /100 | #319 | Tragic 12.9% |
| Cheyenne | 0.0 /100 | #320 | Tragic 13.0% |
| Immigrants | Jamaica | 0.0 /100 | #321 | Tragic 13.0% |
| Natives/Alaskans | 0.0 /100 | #322 | Tragic 13.0% |
| Yakama | 0.0 /100 | #323 | Tragic 13.1% |
| Alaska Natives | 0.0 /100 | #324 | Tragic 13.2% |
| Pueblo | 0.0 /100 | #325 | Tragic 13.2% |
| Immigrants | Barbados | 0.0 /100 | #326 | Tragic 13.5% |
| Immigrants | Dominican Republic | 0.0 /100 | #327 | Tragic 13.6% |
| British West Indians | 0.0 /100 | #328 | Tragic 13.7% |
Demographics Similar to Immigrants from Ethiopia by Unemployment Among Ages 20 to 24 years
In terms of unemployment among ages 20 to 24 years, the demographic groups most similar to Immigrants from Ethiopia are Dutch (9.6%, a difference of 0.040%), Afghan (9.6%, a difference of 0.27%), Immigrants from Zaire (9.6%, a difference of 0.33%), Belgian (9.6%, a difference of 0.41%), and German (9.6%, a difference of 0.45%).
| Demographics | Rating | Rank | Unemployment Among Ages 20 to 24 years |
| Australians | 100.0 /100 | #33 | Exceptional 9.6% |
| Yugoslavians | 100.0 /100 | #34 | Exceptional 9.6% |
| Germans | 100.0 /100 | #35 | Exceptional 9.6% |
| Belgians | 100.0 /100 | #36 | Exceptional 9.6% |
| Immigrants | Zaire | 100.0 /100 | #37 | Exceptional 9.6% |
| Afghans | 99.9 /100 | #38 | Exceptional 9.6% |
| Dutch | 99.9 /100 | #39 | Exceptional 9.6% |
| Immigrants | Ethiopia | 99.9 /100 | #40 | Exceptional 9.6% |
| Swiss | 99.9 /100 | #41 | Exceptional 9.7% |
| Immigrants | Saudi Arabia | 99.9 /100 | #42 | Exceptional 9.7% |
| Menominee | 99.8 /100 | #43 | Exceptional 9.7% |
| Europeans | 99.8 /100 | #44 | Exceptional 9.7% |
| Croatians | 99.8 /100 | #45 | Exceptional 9.7% |
| Immigrants | Nicaragua | 99.8 /100 | #46 | Exceptional 9.7% |
| Immigrants | India | 99.8 /100 | #47 | Exceptional 9.7% |