French Canadian vs Immigrants from Ethiopia Unemployment Among Ages 20 to 24 years
COMPARE
French Canadian
Immigrants from Ethiopia
Unemployment Among Ages 20 to 24 years
Unemployment Among Ages 20 to 24 years Comparison
French Canadians
Immigrants from Ethiopia
10.2%
UNEMPLOYMENT AMONG AGES 20 TO 24 YEARS
77.5/ 100
METRIC RATING
147th/ 347
METRIC RANK
9.6%
UNEMPLOYMENT AMONG AGES 20 TO 24 YEARS
99.9/ 100
METRIC RATING
40th/ 347
METRIC RANK
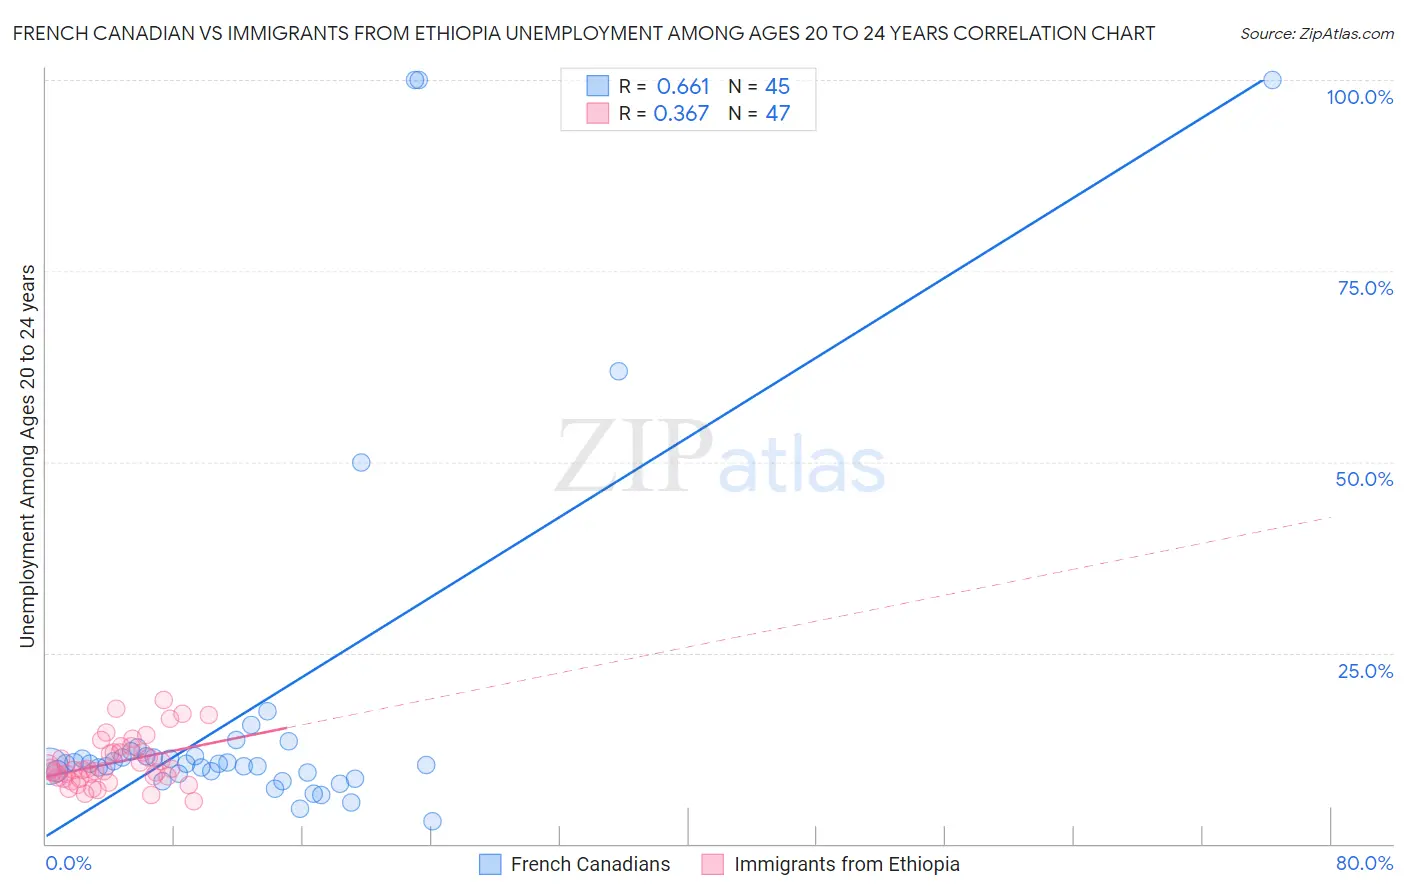
French Canadian vs Immigrants from Ethiopia Unemployment Among Ages 20 to 24 years Correlation Chart
The statistical analysis conducted on geographies consisting of 471,883,331 people shows a significant positive correlation between the proportion of French Canadians and unemployment rate among population between the ages 20 and 24 in the United States with a correlation coefficient (R) of 0.661 and weighted average of 10.2%. Similarly, the statistical analysis conducted on geographies consisting of 209,163,502 people shows a mild positive correlation between the proportion of Immigrants from Ethiopia and unemployment rate among population between the ages 20 and 24 in the United States with a correlation coefficient (R) of 0.367 and weighted average of 9.6%, a difference of 5.9%.
Unemployment Among Ages 20 to 24 years Correlation Summary
| Measurement | French Canadian | Immigrants from Ethiopia |
| Minimum | 3.0% | 5.5% |
| Maximum | 100.0% | 18.8% |
| Range | 97.0% | 13.3% |
| Mean | 18.1% | 10.6% |
| Median | 10.4% | 9.7% |
| Interquartile 25% (IQ1) | 9.3% | 8.5% |
| Interquartile 75% (IQ3) | 11.8% | 11.9% |
| Interquartile Range (IQR) | 2.5% | 3.4% |
| Standard Deviation (Sample) | 24.3% | 3.1% |
| Standard Deviation (Population) | 24.0% | 3.1% |
Similar Demographics by Unemployment Among Ages 20 to 24 years
Demographics Similar to French Canadians by Unemployment Among Ages 20 to 24 years
In terms of unemployment among ages 20 to 24 years, the demographic groups most similar to French Canadians are Asian (10.2%, a difference of 0.010%), Argentinean (10.2%, a difference of 0.030%), Brazilian (10.2%, a difference of 0.040%), Immigrants from Jordan (10.2%, a difference of 0.080%), and Immigrants from Romania (10.2%, a difference of 0.090%).
| Demographics | Rating | Rank | Unemployment Among Ages 20 to 24 years |
| Immigrants | Austria | 81.4 /100 | #140 | Excellent 10.2% |
| Immigrants | Azores | 81.4 /100 | #141 | Excellent 10.2% |
| Slovaks | 80.2 /100 | #142 | Excellent 10.2% |
| Immigrants | Jordan | 79.0 /100 | #143 | Good 10.2% |
| Brazilians | 78.4 /100 | #144 | Good 10.2% |
| Argentineans | 78.0 /100 | #145 | Good 10.2% |
| Asians | 77.7 /100 | #146 | Good 10.2% |
| French Canadians | 77.5 /100 | #147 | Good 10.2% |
| Immigrants | Romania | 75.7 /100 | #148 | Good 10.2% |
| Immigrants | Scotland | 74.6 /100 | #149 | Good 10.2% |
| Hungarians | 74.4 /100 | #150 | Good 10.2% |
| Immigrants | South Africa | 73.6 /100 | #151 | Good 10.2% |
| Iranians | 72.4 /100 | #152 | Good 10.2% |
| Immigrants | Taiwan | 71.4 /100 | #153 | Good 10.2% |
| Immigrants | Switzerland | 71.3 /100 | #154 | Good 10.2% |
Demographics Similar to Immigrants from Ethiopia by Unemployment Among Ages 20 to 24 years
In terms of unemployment among ages 20 to 24 years, the demographic groups most similar to Immigrants from Ethiopia are Dutch (9.6%, a difference of 0.040%), Afghan (9.6%, a difference of 0.27%), Immigrants from Zaire (9.6%, a difference of 0.33%), Belgian (9.6%, a difference of 0.41%), and German (9.6%, a difference of 0.45%).
| Demographics | Rating | Rank | Unemployment Among Ages 20 to 24 years |
| Australians | 100.0 /100 | #33 | Exceptional 9.6% |
| Yugoslavians | 100.0 /100 | #34 | Exceptional 9.6% |
| Germans | 100.0 /100 | #35 | Exceptional 9.6% |
| Belgians | 100.0 /100 | #36 | Exceptional 9.6% |
| Immigrants | Zaire | 100.0 /100 | #37 | Exceptional 9.6% |
| Afghans | 99.9 /100 | #38 | Exceptional 9.6% |
| Dutch | 99.9 /100 | #39 | Exceptional 9.6% |
| Immigrants | Ethiopia | 99.9 /100 | #40 | Exceptional 9.6% |
| Swiss | 99.9 /100 | #41 | Exceptional 9.7% |
| Immigrants | Saudi Arabia | 99.9 /100 | #42 | Exceptional 9.7% |
| Menominee | 99.8 /100 | #43 | Exceptional 9.7% |
| Europeans | 99.8 /100 | #44 | Exceptional 9.7% |
| Croatians | 99.8 /100 | #45 | Exceptional 9.7% |
| Immigrants | Nicaragua | 99.8 /100 | #46 | Exceptional 9.7% |
| Immigrants | India | 99.8 /100 | #47 | Exceptional 9.7% |