Immigrants from Italy vs Laotian Unemployment Among Seniors over 65 years
COMPARE
Immigrants from Italy
Laotian
Unemployment Among Seniors over 65 years
Unemployment Among Seniors over 65 years Comparison
Immigrants from Italy
Laotians
5.2%
UNEMPLOYMENT AMONG SENIORS OVER 65 YEARS
43.5/ 100
METRIC RATING
181st/ 347
METRIC RANK
5.2%
UNEMPLOYMENT AMONG SENIORS OVER 65 YEARS
18.1/ 100
METRIC RATING
201st/ 347
METRIC RANK
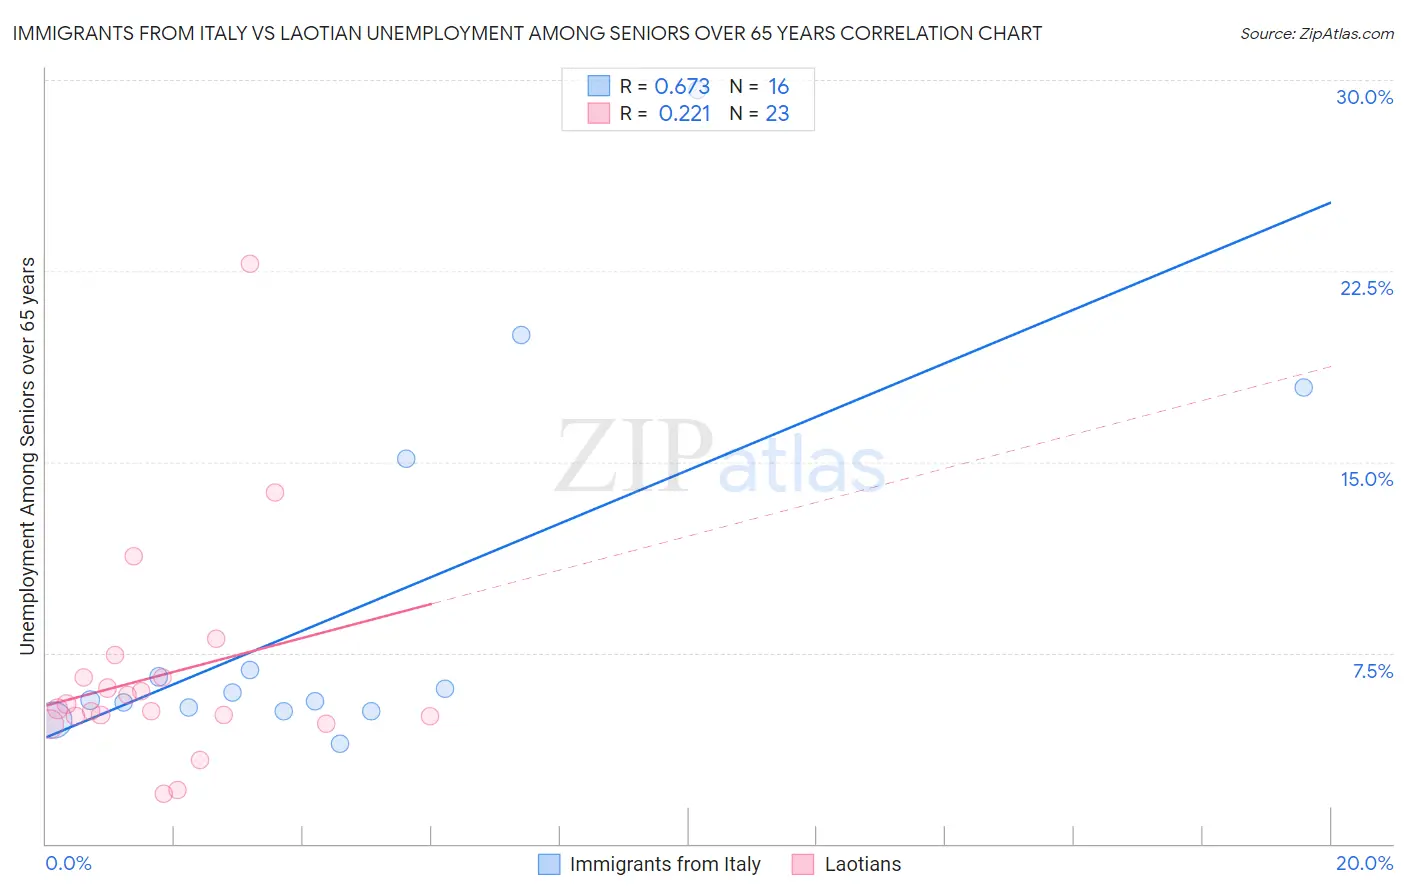
Immigrants from Italy vs Laotian Unemployment Among Seniors over 65 years Correlation Chart
The statistical analysis conducted on geographies consisting of 301,600,513 people shows a significant positive correlation between the proportion of Immigrants from Italy and unemployment rate amomg seniors over the age of 65 in the United States with a correlation coefficient (R) of 0.673 and weighted average of 5.2%. Similarly, the statistical analysis conducted on geographies consisting of 213,153,669 people shows a weak positive correlation between the proportion of Laotians and unemployment rate amomg seniors over the age of 65 in the United States with a correlation coefficient (R) of 0.221 and weighted average of 5.2%, a difference of 0.99%.
Unemployment Among Seniors over 65 years Correlation Summary
| Measurement | Immigrants from Italy | Laotian |
| Minimum | 3.9% | 2.0% |
| Maximum | 29.6% | 22.8% |
| Range | 25.7% | 20.8% |
| Mean | 9.3% | 6.6% |
| Median | 5.8% | 5.3% |
| Interquartile 25% (IQ1) | 5.3% | 5.0% |
| Interquartile 75% (IQ3) | 11.0% | 6.5% |
| Interquartile Range (IQR) | 5.7% | 1.5% |
| Standard Deviation (Sample) | 7.3% | 4.4% |
| Standard Deviation (Population) | 7.1% | 4.3% |
Demographics Similar to Immigrants from Italy and Laotians by Unemployment Among Seniors over 65 years
In terms of unemployment among seniors over 65 years, the demographic groups most similar to Immigrants from Italy are Panamanian (5.2%, a difference of 0.010%), Immigrants from Western Asia (5.2%, a difference of 0.040%), Immigrants from Serbia (5.2%, a difference of 0.060%), Immigrants from Iran (5.2%, a difference of 0.25%), and American (5.2%, a difference of 0.28%). Similarly, the demographic groups most similar to Laotians are Immigrants from Pakistan (5.2%, a difference of 0.020%), Immigrants from Europe (5.2%, a difference of 0.040%), Maltese (5.2%, a difference of 0.080%), Guamanian/Chamorro (5.2%, a difference of 0.21%), and Immigrants from Poland (5.2%, a difference of 0.29%).
| Demographics | Rating | Rank | Unemployment Among Seniors over 65 years |
| Immigrants | Italy | 43.5 /100 | #181 | Average 5.2% |
| Panamanians | 43.0 /100 | #182 | Average 5.2% |
| Immigrants | Western Asia | 42.1 /100 | #183 | Average 5.2% |
| Immigrants | Serbia | 41.6 /100 | #184 | Average 5.2% |
| Immigrants | Iran | 36.0 /100 | #185 | Fair 5.2% |
| Americans | 35.1 /100 | #186 | Fair 5.2% |
| Somalis | 33.5 /100 | #187 | Fair 5.2% |
| Immigrants | Egypt | 33.2 /100 | #188 | Fair 5.2% |
| Bangladeshis | 32.3 /100 | #189 | Fair 5.2% |
| Koreans | 31.6 /100 | #190 | Fair 5.2% |
| Immigrants | Denmark | 31.0 /100 | #191 | Fair 5.2% |
| Sioux | 30.8 /100 | #192 | Fair 5.2% |
| Immigrants | Africa | 29.6 /100 | #193 | Fair 5.2% |
| Argentineans | 29.1 /100 | #194 | Fair 5.2% |
| Costa Ricans | 27.0 /100 | #195 | Fair 5.2% |
| Immigrants | Poland | 24.3 /100 | #196 | Fair 5.2% |
| Guamanians/Chamorros | 22.5 /100 | #197 | Fair 5.2% |
| Maltese | 19.6 /100 | #198 | Poor 5.2% |
| Immigrants | Europe | 19.0 /100 | #199 | Poor 5.2% |
| Immigrants | Pakistan | 18.4 /100 | #200 | Poor 5.2% |
| Laotians | 18.1 /100 | #201 | Poor 5.2% |