Immigrants from Italy vs Immigrants from Grenada Unemployment Among Seniors over 65 years
COMPARE
Immigrants from Italy
Immigrants from Grenada
Unemployment Among Seniors over 65 years
Unemployment Among Seniors over 65 years Comparison
Immigrants from Italy
Immigrants from Grenada
5.2%
UNEMPLOYMENT AMONG SENIORS OVER 65 YEARS
43.5/ 100
METRIC RATING
181st/ 347
METRIC RANK
5.4%
UNEMPLOYMENT AMONG SENIORS OVER 65 YEARS
0.2/ 100
METRIC RATING
262nd/ 347
METRIC RANK
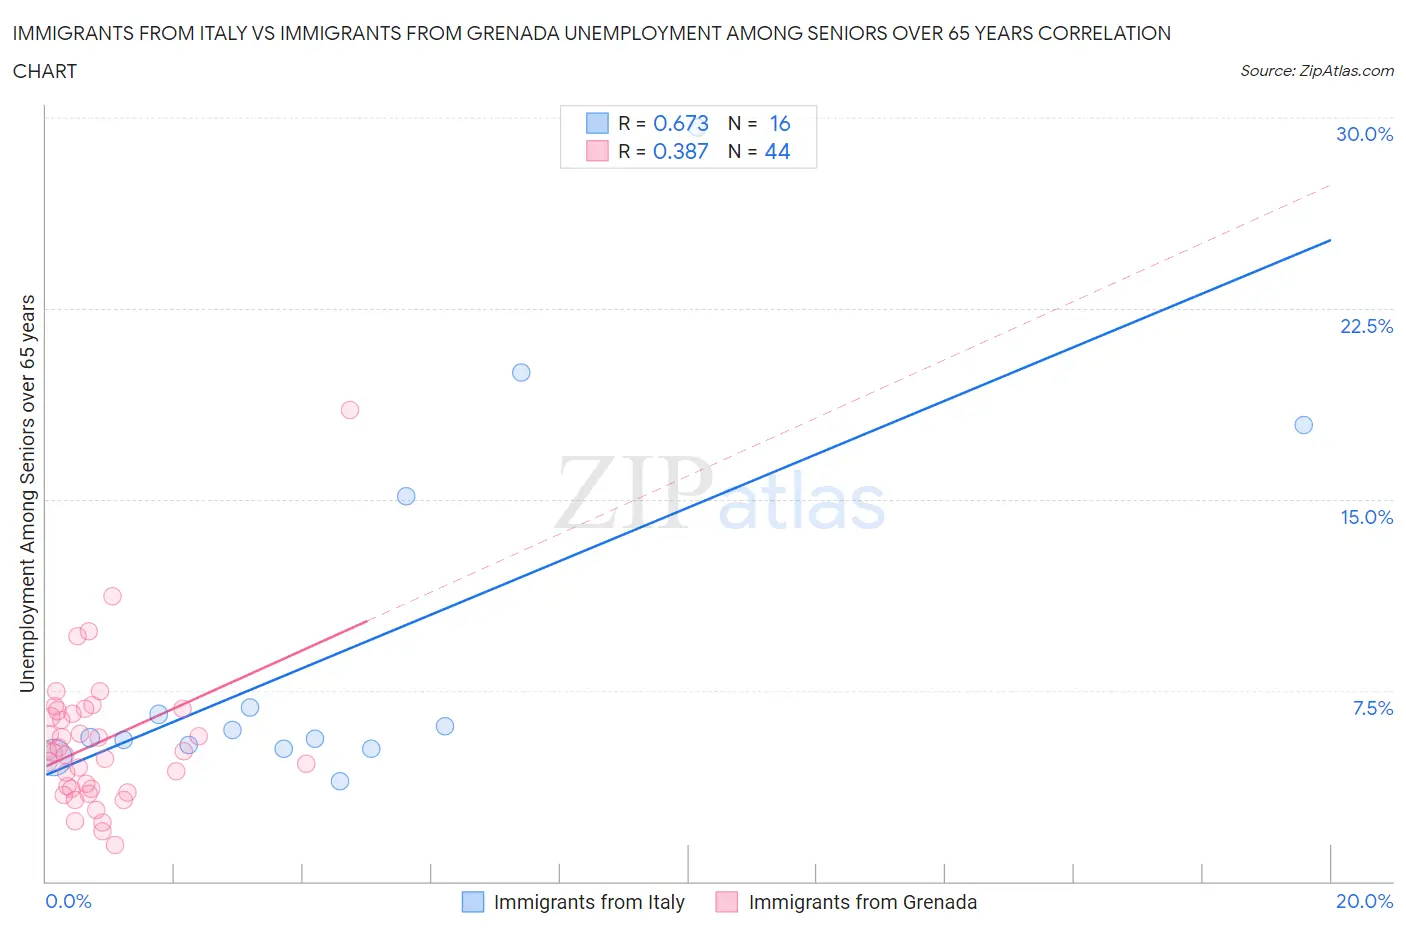
Immigrants from Italy vs Immigrants from Grenada Unemployment Among Seniors over 65 years Correlation Chart
The statistical analysis conducted on geographies consisting of 301,600,513 people shows a significant positive correlation between the proportion of Immigrants from Italy and unemployment rate amomg seniors over the age of 65 in the United States with a correlation coefficient (R) of 0.673 and weighted average of 5.2%. Similarly, the statistical analysis conducted on geographies consisting of 65,234,875 people shows a mild positive correlation between the proportion of Immigrants from Grenada and unemployment rate amomg seniors over the age of 65 in the United States with a correlation coefficient (R) of 0.387 and weighted average of 5.4%, a difference of 4.7%.
Unemployment Among Seniors over 65 years Correlation Summary
| Measurement | Immigrants from Italy | Immigrants from Grenada |
| Minimum | 3.9% | 1.4% |
| Maximum | 29.6% | 18.5% |
| Range | 25.7% | 17.1% |
| Mean | 9.3% | 5.5% |
| Median | 5.8% | 5.1% |
| Interquartile 25% (IQ1) | 5.3% | 3.6% |
| Interquartile 75% (IQ3) | 11.0% | 6.7% |
| Interquartile Range (IQR) | 5.7% | 3.0% |
| Standard Deviation (Sample) | 7.3% | 2.9% |
| Standard Deviation (Population) | 7.1% | 2.8% |
Similar Demographics by Unemployment Among Seniors over 65 years
Demographics Similar to Immigrants from Italy by Unemployment Among Seniors over 65 years
In terms of unemployment among seniors over 65 years, the demographic groups most similar to Immigrants from Italy are Russian (5.2%, a difference of 0.0%), Panamanian (5.2%, a difference of 0.010%), Immigrants from Somalia (5.2%, a difference of 0.020%), Immigrants from Belgium (5.2%, a difference of 0.040%), and Immigrants from Western Asia (5.2%, a difference of 0.040%).
| Demographics | Rating | Rank | Unemployment Among Seniors over 65 years |
| Spanish Americans | 50.0 /100 | #174 | Average 5.1% |
| Immigrants | Eastern Europe | 49.8 /100 | #175 | Average 5.1% |
| Indians (Asian) | 46.6 /100 | #176 | Average 5.2% |
| Icelanders | 45.9 /100 | #177 | Average 5.2% |
| Immigrants | Belgium | 44.8 /100 | #178 | Average 5.2% |
| Immigrants | Somalia | 44.0 /100 | #179 | Average 5.2% |
| Russians | 43.6 /100 | #180 | Average 5.2% |
| Immigrants | Italy | 43.5 /100 | #181 | Average 5.2% |
| Panamanians | 43.0 /100 | #182 | Average 5.2% |
| Immigrants | Western Asia | 42.1 /100 | #183 | Average 5.2% |
| Immigrants | Serbia | 41.6 /100 | #184 | Average 5.2% |
| Immigrants | Iran | 36.0 /100 | #185 | Fair 5.2% |
| Americans | 35.1 /100 | #186 | Fair 5.2% |
| Somalis | 33.5 /100 | #187 | Fair 5.2% |
| Immigrants | Egypt | 33.2 /100 | #188 | Fair 5.2% |
Demographics Similar to Immigrants from Grenada by Unemployment Among Seniors over 65 years
In terms of unemployment among seniors over 65 years, the demographic groups most similar to Immigrants from Grenada are South American (5.4%, a difference of 0.050%), Spanish American Indian (5.4%, a difference of 0.070%), Native Hawaiian (5.4%, a difference of 0.15%), Central American Indian (5.4%, a difference of 0.17%), and Immigrants from Colombia (5.4%, a difference of 0.18%).
| Demographics | Rating | Rank | Unemployment Among Seniors over 65 years |
| Immigrants | Peru | 0.5 /100 | #255 | Tragic 5.4% |
| Moroccans | 0.5 /100 | #256 | Tragic 5.4% |
| Immigrants | Micronesia | 0.4 /100 | #257 | Tragic 5.4% |
| Sierra Leoneans | 0.4 /100 | #258 | Tragic 5.4% |
| Immigrants | Ghana | 0.4 /100 | #259 | Tragic 5.4% |
| Native Hawaiians | 0.3 /100 | #260 | Tragic 5.4% |
| Spanish American Indians | 0.2 /100 | #261 | Tragic 5.4% |
| Immigrants | Grenada | 0.2 /100 | #262 | Tragic 5.4% |
| South Americans | 0.2 /100 | #263 | Tragic 5.4% |
| Central American Indians | 0.2 /100 | #264 | Tragic 5.4% |
| Immigrants | Colombia | 0.2 /100 | #265 | Tragic 5.4% |
| Pennsylvania Germans | 0.2 /100 | #266 | Tragic 5.4% |
| Chippewa | 0.2 /100 | #267 | Tragic 5.4% |
| Hawaiians | 0.1 /100 | #268 | Tragic 5.4% |
| Immigrants | Southern Europe | 0.1 /100 | #269 | Tragic 5.4% |