Immigrants from Ireland vs Immigrants from Ukraine Unemployment Among Youth under 25 years
COMPARE
Immigrants from Ireland
Immigrants from Ukraine
Unemployment Among Youth under 25 years
Unemployment Among Youth under 25 years Comparison
Immigrants from Ireland
Immigrants from Ukraine
12.0%
UNEMPLOYMENT AMONG YOUTH UNDER 25 YEARS
3.5/ 100
METRIC RATING
223rd/ 347
METRIC RANK
12.0%
UNEMPLOYMENT AMONG YOUTH UNDER 25 YEARS
3.0/ 100
METRIC RATING
225th/ 347
METRIC RANK
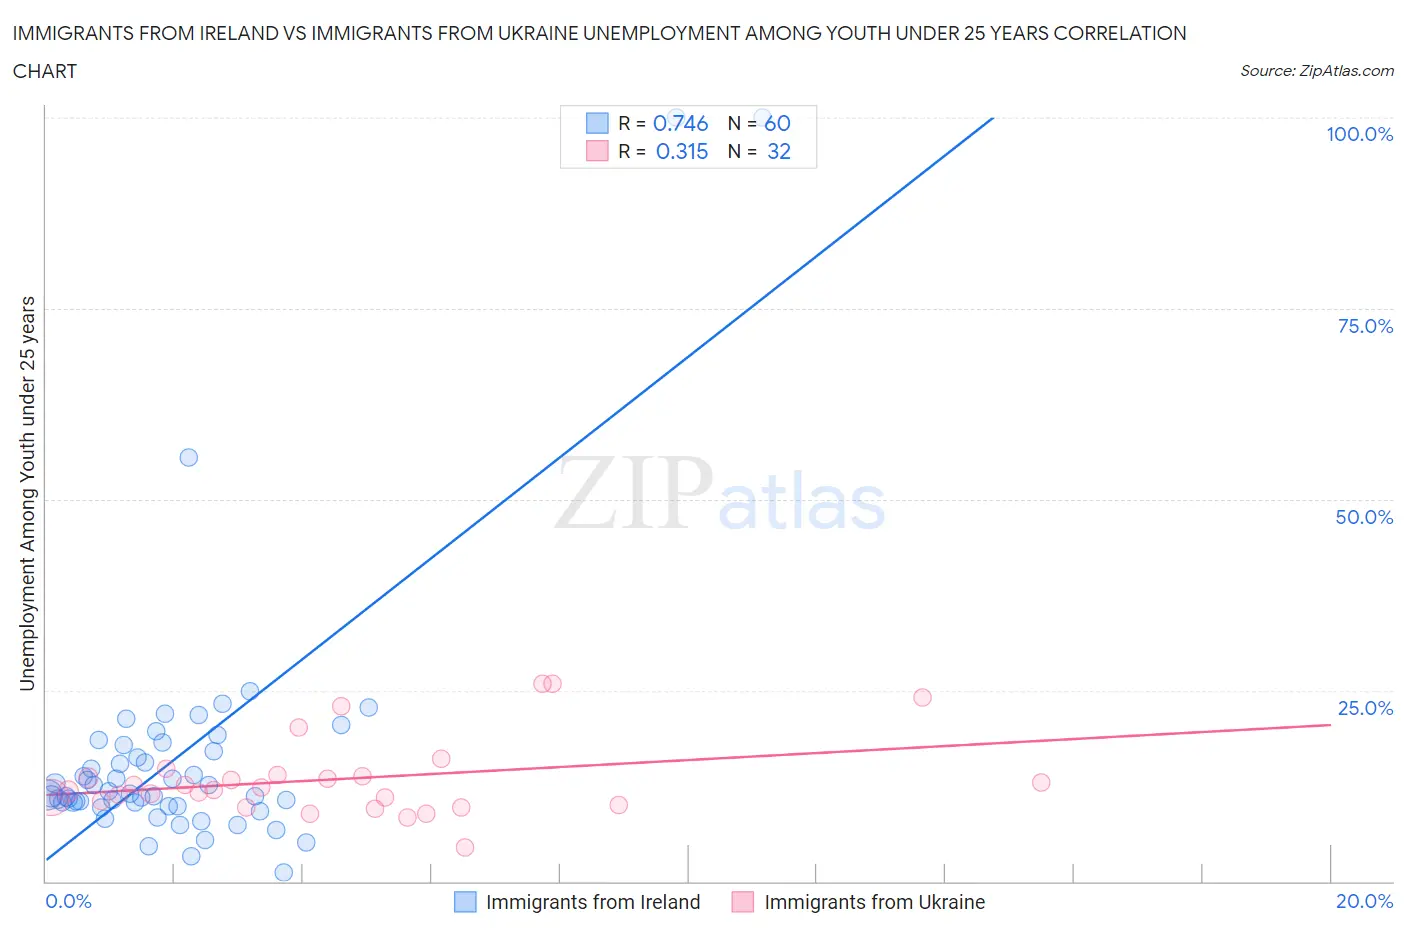
Immigrants from Ireland vs Immigrants from Ukraine Unemployment Among Youth under 25 years Correlation Chart
The statistical analysis conducted on geographies consisting of 238,594,330 people shows a strong positive correlation between the proportion of Immigrants from Ireland and unemployment rate among youth under the age of 25 in the United States with a correlation coefficient (R) of 0.746 and weighted average of 12.0%. Similarly, the statistical analysis conducted on geographies consisting of 287,281,980 people shows a mild positive correlation between the proportion of Immigrants from Ukraine and unemployment rate among youth under the age of 25 in the United States with a correlation coefficient (R) of 0.315 and weighted average of 12.0%, a difference of 0.16%.
Unemployment Among Youth under 25 years Correlation Summary
| Measurement | Immigrants from Ireland | Immigrants from Ukraine |
| Minimum | 1.2% | 4.5% |
| Maximum | 100.0% | 25.9% |
| Range | 98.8% | 21.4% |
| Mean | 16.3% | 13.4% |
| Median | 11.4% | 12.1% |
| Interquartile 25% (IQ1) | 10.1% | 10.3% |
| Interquartile 75% (IQ3) | 17.5% | 13.8% |
| Interquartile Range (IQR) | 7.4% | 3.5% |
| Standard Deviation (Sample) | 17.4% | 5.1% |
| Standard Deviation (Population) | 17.2% | 5.0% |
Demographics Similar to Immigrants from Ireland and Immigrants from Ukraine by Unemployment Among Youth under 25 years
In terms of unemployment among youth under 25 years, the demographic groups most similar to Immigrants from Ireland are Hawaiian (12.0%, a difference of 0.010%), Israeli (12.0%, a difference of 0.15%), Immigrants from Israel (12.0%, a difference of 0.30%), Immigrants from Iran (12.0%, a difference of 0.32%), and Immigrants from Portugal (12.0%, a difference of 0.34%). Similarly, the demographic groups most similar to Immigrants from Ukraine are Immigrants from Israel (12.0%, a difference of 0.14%), Hawaiian (12.0%, a difference of 0.15%), Immigrants from Iran (12.0%, a difference of 0.16%), Israeli (12.0%, a difference of 0.30%), and Immigrants from Fiji (12.1%, a difference of 0.39%).
| Demographics | Rating | Rank | Unemployment Among Youth under 25 years |
| Costa Ricans | 8.2 /100 | #214 | Tragic 11.9% |
| Samoans | 7.4 /100 | #215 | Tragic 11.9% |
| Guamanians/Chamorros | 7.0 /100 | #216 | Tragic 11.9% |
| Yaqui | 6.9 /100 | #217 | Tragic 11.9% |
| Immigrants | Middle Africa | 6.8 /100 | #218 | Tragic 11.9% |
| Immigrants | Nonimmigrants | 6.2 /100 | #219 | Tragic 11.9% |
| Alsatians | 6.1 /100 | #220 | Tragic 11.9% |
| Immigrants | Portugal | 4.9 /100 | #221 | Tragic 12.0% |
| Israelis | 4.1 /100 | #222 | Tragic 12.0% |
| Immigrants | Ireland | 3.5 /100 | #223 | Tragic 12.0% |
| Hawaiians | 3.5 /100 | #224 | Tragic 12.0% |
| Immigrants | Ukraine | 3.0 /100 | #225 | Tragic 12.0% |
| Immigrants | Israel | 2.6 /100 | #226 | Tragic 12.0% |
| Immigrants | Iran | 2.6 /100 | #227 | Tragic 12.0% |
| Immigrants | Fiji | 2.1 /100 | #228 | Tragic 12.1% |
| Moroccans | 2.1 /100 | #229 | Tragic 12.1% |
| Choctaw | 1.9 /100 | #230 | Tragic 12.1% |
| Immigrants | South America | 1.8 /100 | #231 | Tragic 12.1% |
| Immigrants | Belarus | 1.6 /100 | #232 | Tragic 12.1% |
| South American Indians | 1.6 /100 | #233 | Tragic 12.1% |
| Guatemalans | 1.4 /100 | #234 | Tragic 12.1% |