Immigrants from Ireland vs Guamanian/Chamorro Unemployment Among Youth under 25 years
COMPARE
Immigrants from Ireland
Guamanian/Chamorro
Unemployment Among Youth under 25 years
Unemployment Among Youth under 25 years Comparison
Immigrants from Ireland
Guamanians/Chamorros
12.0%
UNEMPLOYMENT AMONG YOUTH UNDER 25 YEARS
3.5/ 100
METRIC RATING
223rd/ 347
METRIC RANK
11.9%
UNEMPLOYMENT AMONG YOUTH UNDER 25 YEARS
7.0/ 100
METRIC RATING
216th/ 347
METRIC RANK
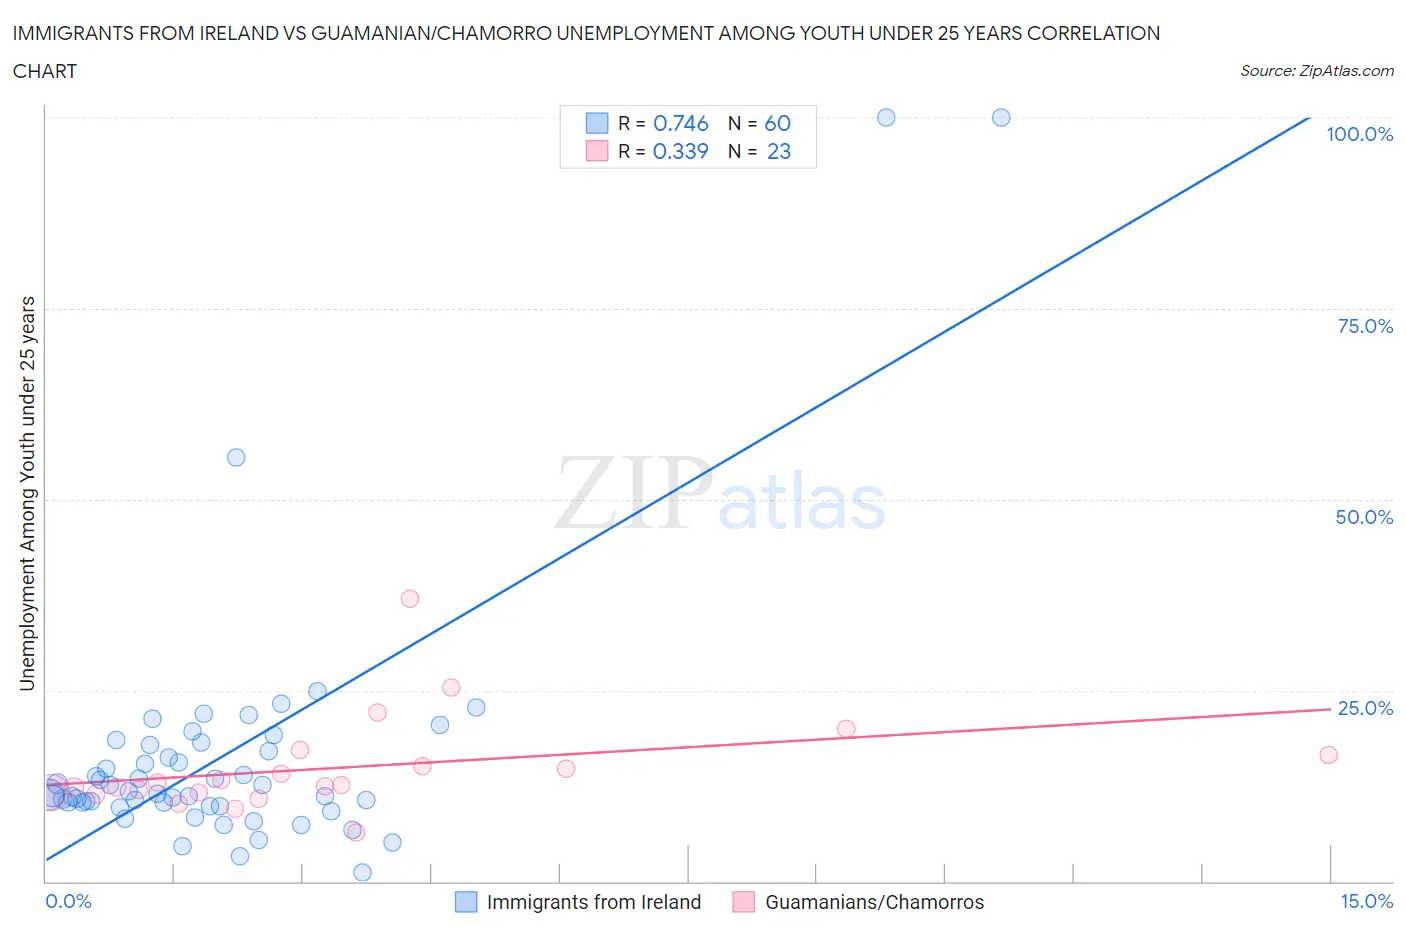
Immigrants from Ireland vs Guamanian/Chamorro Unemployment Among Youth under 25 years Correlation Chart
The statistical analysis conducted on geographies consisting of 238,594,330 people shows a strong positive correlation between the proportion of Immigrants from Ireland and unemployment rate among youth under the age of 25 in the United States with a correlation coefficient (R) of 0.746 and weighted average of 12.0%. Similarly, the statistical analysis conducted on geographies consisting of 220,678,846 people shows a mild positive correlation between the proportion of Guamanians/Chamorros and unemployment rate among youth under the age of 25 in the United States with a correlation coefficient (R) of 0.339 and weighted average of 11.9%, a difference of 0.72%.
Unemployment Among Youth under 25 years Correlation Summary
| Measurement | Immigrants from Ireland | Guamanian/Chamorro |
| Minimum | 1.2% | 6.4% |
| Maximum | 100.0% | 37.0% |
| Range | 98.8% | 30.6% |
| Mean | 16.3% | 14.8% |
| Median | 11.4% | 12.6% |
| Interquartile 25% (IQ1) | 10.1% | 11.6% |
| Interquartile 75% (IQ3) | 17.5% | 16.6% |
| Interquartile Range (IQR) | 7.4% | 5.0% |
| Standard Deviation (Sample) | 17.4% | 6.4% |
| Standard Deviation (Population) | 17.2% | 6.2% |
Demographics Similar to Immigrants from Ireland and Guamanians/Chamorros by Unemployment Among Youth under 25 years
In terms of unemployment among youth under 25 years, the demographic groups most similar to Immigrants from Ireland are Hawaiian (12.0%, a difference of 0.010%), Israeli (12.0%, a difference of 0.15%), Immigrants from Ukraine (12.0%, a difference of 0.16%), Immigrants from Israel (12.0%, a difference of 0.30%), and Immigrants from Iran (12.0%, a difference of 0.32%). Similarly, the demographic groups most similar to Guamanians/Chamorros are Yaqui (11.9%, a difference of 0.010%), Immigrants from Middle Africa (11.9%, a difference of 0.020%), Samoan (11.9%, a difference of 0.060%), Nonimmigrants (11.9%, a difference of 0.13%), and Alsatian (11.9%, a difference of 0.15%).
| Demographics | Rating | Rank | Unemployment Among Youth under 25 years |
| Immigrants | Lebanon | 11.3 /100 | #209 | Poor 11.8% |
| Assyrians/Chaldeans/Syriacs | 9.8 /100 | #210 | Tragic 11.9% |
| Immigrants | Philippines | 9.2 /100 | #211 | Tragic 11.9% |
| Colombians | 9.1 /100 | #212 | Tragic 11.9% |
| South Americans | 8.5 /100 | #213 | Tragic 11.9% |
| Costa Ricans | 8.2 /100 | #214 | Tragic 11.9% |
| Samoans | 7.4 /100 | #215 | Tragic 11.9% |
| Guamanians/Chamorros | 7.0 /100 | #216 | Tragic 11.9% |
| Yaqui | 6.9 /100 | #217 | Tragic 11.9% |
| Immigrants | Middle Africa | 6.8 /100 | #218 | Tragic 11.9% |
| Immigrants | Nonimmigrants | 6.2 /100 | #219 | Tragic 11.9% |
| Alsatians | 6.1 /100 | #220 | Tragic 11.9% |
| Immigrants | Portugal | 4.9 /100 | #221 | Tragic 12.0% |
| Israelis | 4.1 /100 | #222 | Tragic 12.0% |
| Immigrants | Ireland | 3.5 /100 | #223 | Tragic 12.0% |
| Hawaiians | 3.5 /100 | #224 | Tragic 12.0% |
| Immigrants | Ukraine | 3.0 /100 | #225 | Tragic 12.0% |
| Immigrants | Israel | 2.6 /100 | #226 | Tragic 12.0% |
| Immigrants | Iran | 2.6 /100 | #227 | Tragic 12.0% |
| Immigrants | Fiji | 2.1 /100 | #228 | Tragic 12.1% |
| Moroccans | 2.1 /100 | #229 | Tragic 12.1% |