Immigrants from Greece vs Immigrants from Trinidad and Tobago Unemployment Among Women with Children Under 18 years
COMPARE
Immigrants from Greece
Immigrants from Trinidad and Tobago
Unemployment Among Women with Children Under 18 years
Unemployment Among Women with Children Under 18 years Comparison
Immigrants from Greece
Immigrants from Trinidad and Tobago
5.2%
UNEMPLOYMENT AMONG WOMEN WITH CHILDREN UNDER 18 YEARS
91.4/ 100
METRIC RATING
100th/ 347
METRIC RANK
6.1%
UNEMPLOYMENT AMONG WOMEN WITH CHILDREN UNDER 18 YEARS
0.1/ 100
METRIC RATING
262nd/ 347
METRIC RANK
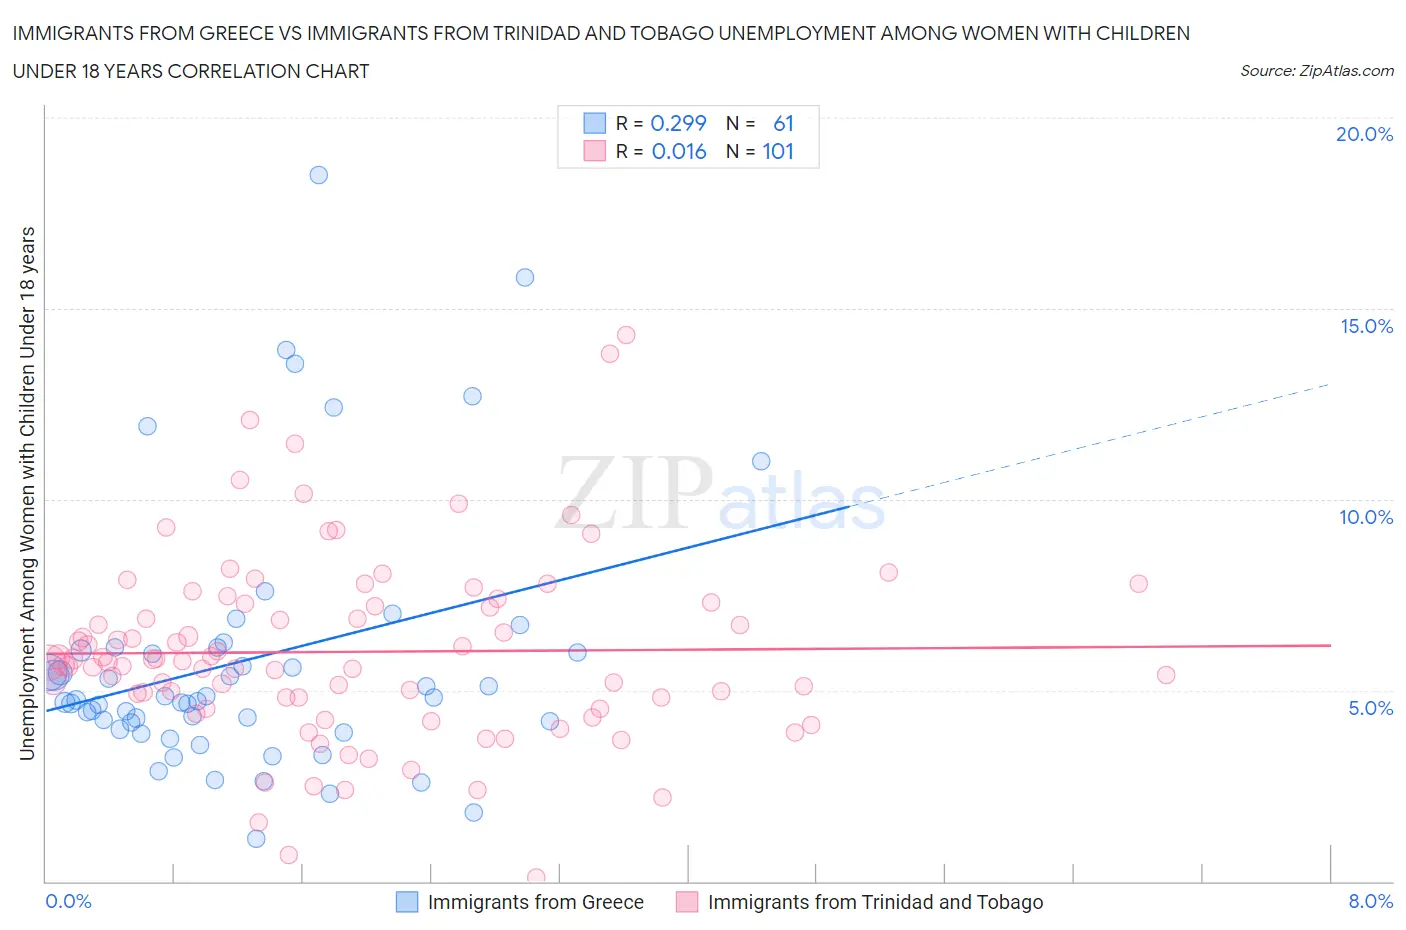
Immigrants from Greece vs Immigrants from Trinidad and Tobago Unemployment Among Women with Children Under 18 years Correlation Chart
The statistical analysis conducted on geographies consisting of 211,539,511 people shows a weak positive correlation between the proportion of Immigrants from Greece and unemployment rate among women with children under the age of 18 in the United States with a correlation coefficient (R) of 0.299 and weighted average of 5.2%. Similarly, the statistical analysis conducted on geographies consisting of 219,495,457 people shows no correlation between the proportion of Immigrants from Trinidad and Tobago and unemployment rate among women with children under the age of 18 in the United States with a correlation coefficient (R) of 0.016 and weighted average of 6.1%, a difference of 17.6%.
Unemployment Among Women with Children Under 18 years Correlation Summary
| Measurement | Immigrants from Greece | Immigrants from Trinidad and Tobago |
| Minimum | 1.1% | 0.10% |
| Maximum | 18.5% | 14.3% |
| Range | 17.4% | 14.2% |
| Mean | 5.8% | 6.0% |
| Median | 4.7% | 5.7% |
| Interquartile 25% (IQ1) | 4.1% | 4.7% |
| Interquartile 75% (IQ3) | 6.1% | 7.3% |
| Interquartile Range (IQR) | 2.0% | 2.6% |
| Standard Deviation (Sample) | 3.4% | 2.4% |
| Standard Deviation (Population) | 3.4% | 2.4% |
Similar Demographics by Unemployment Among Women with Children Under 18 years
Demographics Similar to Immigrants from Greece by Unemployment Among Women with Children Under 18 years
In terms of unemployment among women with children under 18 years, the demographic groups most similar to Immigrants from Greece are Cuban (5.2%, a difference of 0.090%), Immigrants from Netherlands (5.2%, a difference of 0.10%), Immigrants from Cuba (5.2%, a difference of 0.10%), Immigrants from Vietnam (5.2%, a difference of 0.16%), and Palestinian (5.2%, a difference of 0.19%).
| Demographics | Rating | Rank | Unemployment Among Women with Children Under 18 years |
| Immigrants | Canada | 93.3 /100 | #93 | Exceptional 5.2% |
| Immigrants | Kuwait | 92.6 /100 | #94 | Exceptional 5.2% |
| Immigrants | North America | 92.3 /100 | #95 | Exceptional 5.2% |
| Immigrants | Albania | 92.2 /100 | #96 | Exceptional 5.2% |
| Palestinians | 92.2 /100 | #97 | Exceptional 5.2% |
| Immigrants | Vietnam | 92.0 /100 | #98 | Exceptional 5.2% |
| Cubans | 91.8 /100 | #99 | Exceptional 5.2% |
| Immigrants | Greece | 91.4 /100 | #100 | Exceptional 5.2% |
| Immigrants | Netherlands | 91.0 /100 | #101 | Exceptional 5.2% |
| Immigrants | Cuba | 90.9 /100 | #102 | Exceptional 5.2% |
| Sri Lankans | 90.3 /100 | #103 | Exceptional 5.2% |
| Immigrants | Switzerland | 90.1 /100 | #104 | Exceptional 5.2% |
| Immigrants | France | 90.0 /100 | #105 | Excellent 5.2% |
| Pakistanis | 89.9 /100 | #106 | Excellent 5.2% |
| Slavs | 89.8 /100 | #107 | Excellent 5.2% |
Demographics Similar to Immigrants from Trinidad and Tobago by Unemployment Among Women with Children Under 18 years
In terms of unemployment among women with children under 18 years, the demographic groups most similar to Immigrants from Trinidad and Tobago are Immigrants from Liberia (6.1%, a difference of 0.0%), Spanish American Indian (6.1%, a difference of 0.020%), Comanche (6.1%, a difference of 0.090%), Nigerian (6.1%, a difference of 0.10%), and Ottawa (6.1%, a difference of 0.12%).
| Demographics | Rating | Rank | Unemployment Among Women with Children Under 18 years |
| Liberians | 0.2 /100 | #255 | Tragic 6.0% |
| Nepalese | 0.2 /100 | #256 | Tragic 6.0% |
| Bermudans | 0.1 /100 | #257 | Tragic 6.1% |
| Immigrants | Nigeria | 0.1 /100 | #258 | Tragic 6.1% |
| Ottawa | 0.1 /100 | #259 | Tragic 6.1% |
| Nigerians | 0.1 /100 | #260 | Tragic 6.1% |
| Immigrants | Liberia | 0.1 /100 | #261 | Tragic 6.1% |
| Immigrants | Trinidad and Tobago | 0.1 /100 | #262 | Tragic 6.1% |
| Spanish American Indians | 0.1 /100 | #263 | Tragic 6.1% |
| Comanche | 0.1 /100 | #264 | Tragic 6.1% |
| Immigrants | Bahamas | 0.1 /100 | #265 | Tragic 6.1% |
| Sub-Saharan Africans | 0.1 /100 | #266 | Tragic 6.2% |
| French American Indians | 0.1 /100 | #267 | Tragic 6.2% |
| Trinidadians and Tobagonians | 0.1 /100 | #268 | Tragic 6.2% |
| Cajuns | 0.1 /100 | #269 | Tragic 6.2% |