Immigrants from Greece vs Albanian Unemployment Among Women with Children Under 18 years
COMPARE
Immigrants from Greece
Albanian
Unemployment Among Women with Children Under 18 years
Unemployment Among Women with Children Under 18 years Comparison
Immigrants from Greece
Albanians
5.2%
UNEMPLOYMENT AMONG WOMEN WITH CHILDREN UNDER 18 YEARS
91.4/ 100
METRIC RATING
100th/ 347
METRIC RANK
5.1%
UNEMPLOYMENT AMONG WOMEN WITH CHILDREN UNDER 18 YEARS
95.9/ 100
METRIC RATING
73rd/ 347
METRIC RANK
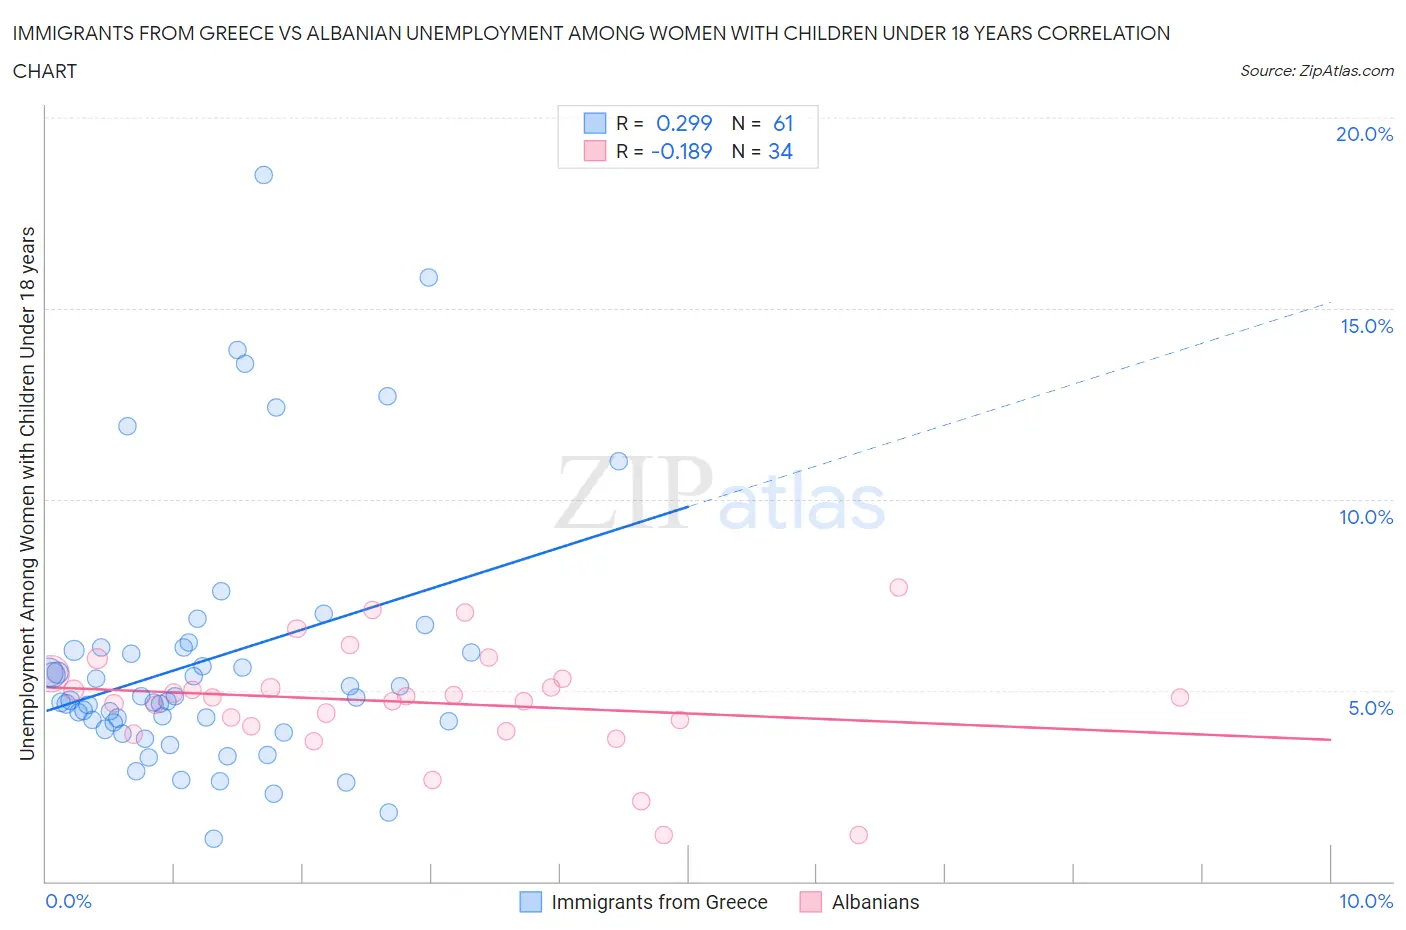
Immigrants from Greece vs Albanian Unemployment Among Women with Children Under 18 years Correlation Chart
The statistical analysis conducted on geographies consisting of 211,539,511 people shows a weak positive correlation between the proportion of Immigrants from Greece and unemployment rate among women with children under the age of 18 in the United States with a correlation coefficient (R) of 0.299 and weighted average of 5.2%. Similarly, the statistical analysis conducted on geographies consisting of 188,327,810 people shows a poor negative correlation between the proportion of Albanians and unemployment rate among women with children under the age of 18 in the United States with a correlation coefficient (R) of -0.189 and weighted average of 5.1%, a difference of 1.5%.
Unemployment Among Women with Children Under 18 years Correlation Summary
| Measurement | Immigrants from Greece | Albanian |
| Minimum | 1.1% | 1.2% |
| Maximum | 18.5% | 7.7% |
| Range | 17.4% | 6.5% |
| Mean | 5.8% | 4.7% |
| Median | 4.7% | 4.8% |
| Interquartile 25% (IQ1) | 4.1% | 4.1% |
| Interquartile 75% (IQ3) | 6.1% | 5.3% |
| Interquartile Range (IQR) | 2.0% | 1.2% |
| Standard Deviation (Sample) | 3.4% | 1.5% |
| Standard Deviation (Population) | 3.4% | 1.4% |
Similar Demographics by Unemployment Among Women with Children Under 18 years
Demographics Similar to Immigrants from Greece by Unemployment Among Women with Children Under 18 years
In terms of unemployment among women with children under 18 years, the demographic groups most similar to Immigrants from Greece are Cuban (5.2%, a difference of 0.090%), Immigrants from Netherlands (5.2%, a difference of 0.10%), Immigrants from Cuba (5.2%, a difference of 0.10%), Immigrants from Vietnam (5.2%, a difference of 0.16%), and Palestinian (5.2%, a difference of 0.19%).
| Demographics | Rating | Rank | Unemployment Among Women with Children Under 18 years |
| Immigrants | Canada | 93.3 /100 | #93 | Exceptional 5.2% |
| Immigrants | Kuwait | 92.6 /100 | #94 | Exceptional 5.2% |
| Immigrants | North America | 92.3 /100 | #95 | Exceptional 5.2% |
| Immigrants | Albania | 92.2 /100 | #96 | Exceptional 5.2% |
| Palestinians | 92.2 /100 | #97 | Exceptional 5.2% |
| Immigrants | Vietnam | 92.0 /100 | #98 | Exceptional 5.2% |
| Cubans | 91.8 /100 | #99 | Exceptional 5.2% |
| Immigrants | Greece | 91.4 /100 | #100 | Exceptional 5.2% |
| Immigrants | Netherlands | 91.0 /100 | #101 | Exceptional 5.2% |
| Immigrants | Cuba | 90.9 /100 | #102 | Exceptional 5.2% |
| Sri Lankans | 90.3 /100 | #103 | Exceptional 5.2% |
| Immigrants | Switzerland | 90.1 /100 | #104 | Exceptional 5.2% |
| Immigrants | France | 90.0 /100 | #105 | Excellent 5.2% |
| Pakistanis | 89.9 /100 | #106 | Excellent 5.2% |
| Slavs | 89.8 /100 | #107 | Excellent 5.2% |
Demographics Similar to Albanians by Unemployment Among Women with Children Under 18 years
In terms of unemployment among women with children under 18 years, the demographic groups most similar to Albanians are Immigrants from Northern Europe (5.1%, a difference of 0.010%), Immigrants from Asia (5.1%, a difference of 0.040%), Immigrants from Bolivia (5.1%, a difference of 0.070%), Puget Sound Salish (5.1%, a difference of 0.070%), and Zimbabwean (5.1%, a difference of 0.090%).
| Demographics | Rating | Rank | Unemployment Among Women with Children Under 18 years |
| Immigrants | Australia | 97.0 /100 | #66 | Exceptional 5.1% |
| Fijians | 96.9 /100 | #67 | Exceptional 5.1% |
| Irish | 96.8 /100 | #68 | Exceptional 5.1% |
| Austrians | 96.6 /100 | #69 | Exceptional 5.1% |
| Icelanders | 96.6 /100 | #70 | Exceptional 5.1% |
| Serbians | 96.5 /100 | #71 | Exceptional 5.1% |
| Immigrants | Bolivia | 96.1 /100 | #72 | Exceptional 5.1% |
| Albanians | 95.9 /100 | #73 | Exceptional 5.1% |
| Immigrants | Northern Europe | 95.9 /100 | #74 | Exceptional 5.1% |
| Immigrants | Asia | 95.8 /100 | #75 | Exceptional 5.1% |
| Puget Sound Salish | 95.8 /100 | #76 | Exceptional 5.1% |
| Zimbabweans | 95.7 /100 | #77 | Exceptional 5.1% |
| Assyrians/Chaldeans/Syriacs | 95.7 /100 | #78 | Exceptional 5.1% |
| Immigrants | Croatia | 95.6 /100 | #79 | Exceptional 5.1% |
| Bolivians | 95.5 /100 | #80 | Exceptional 5.1% |