Immigrants from Greece vs Cheyenne Unemployment Among Women with Children Ages 6 to 17 years
COMPARE
Immigrants from Greece
Cheyenne
Unemployment Among Women with Children Ages 6 to 17 years
Unemployment Among Women with Children Ages 6 to 17 years Comparison
Immigrants from Greece
Cheyenne
8.9%
UNEMPLOYMENT AMONG WOMEN WITH CHILDREN AGES 6 TO 17 YEARS
71.8/ 100
METRIC RATING
155th/ 347
METRIC RANK
16.4%
UNEMPLOYMENT AMONG WOMEN WITH CHILDREN AGES 6 TO 17 YEARS
0.0/ 100
METRIC RATING
344th/ 347
METRIC RANK
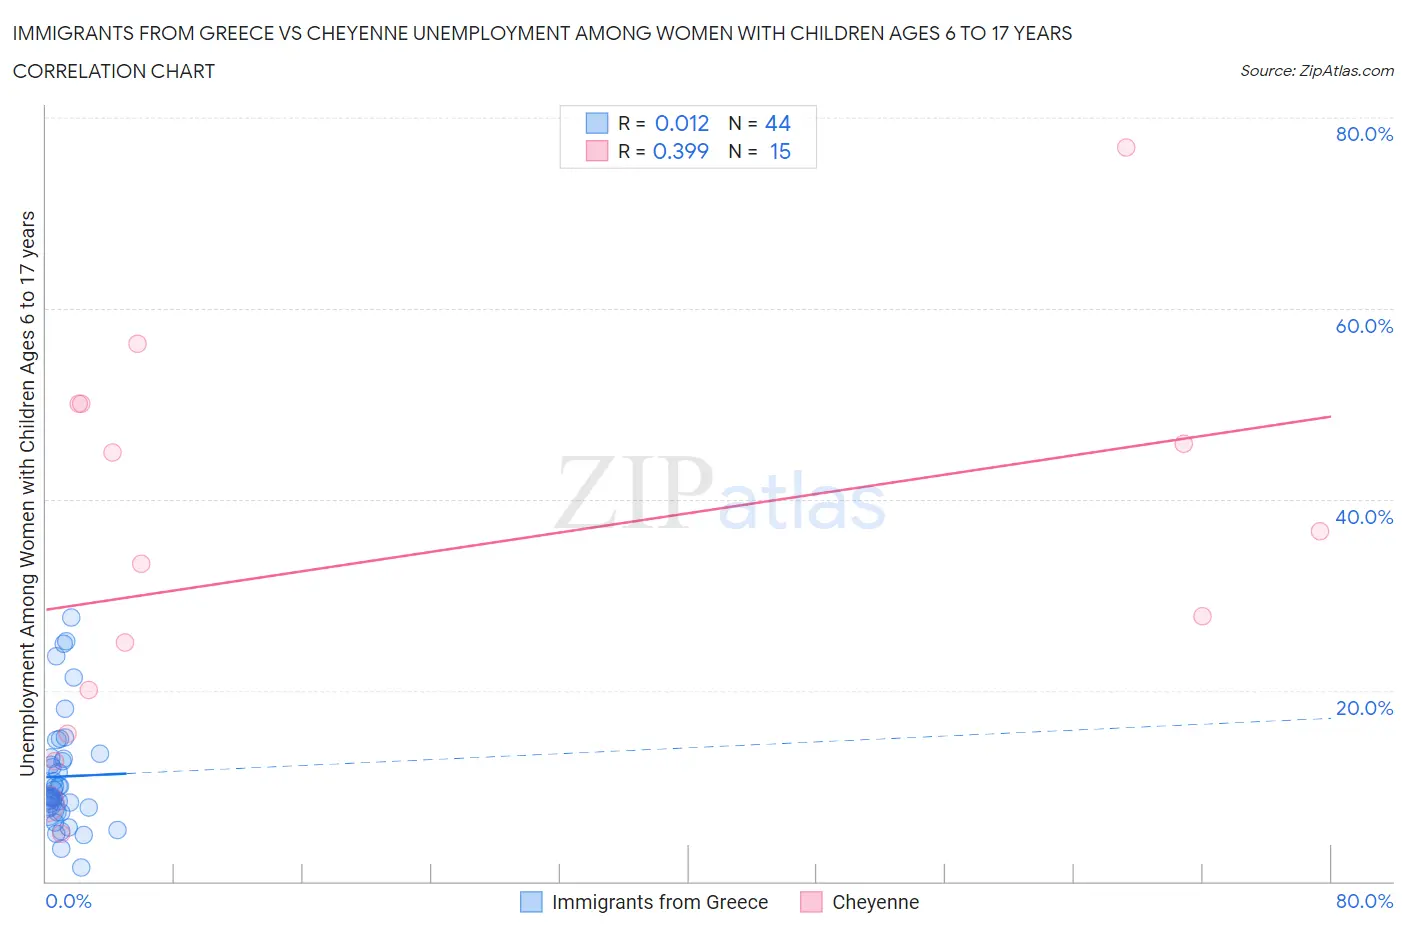
Immigrants from Greece vs Cheyenne Unemployment Among Women with Children Ages 6 to 17 years Correlation Chart
The statistical analysis conducted on geographies consisting of 166,460,086 people shows no correlation between the proportion of Immigrants from Greece and unemployment rate among women with children between the ages 6 and 17 in the United States with a correlation coefficient (R) of 0.012 and weighted average of 8.9%. Similarly, the statistical analysis conducted on geographies consisting of 72,086,301 people shows a mild positive correlation between the proportion of Cheyenne and unemployment rate among women with children between the ages 6 and 17 in the United States with a correlation coefficient (R) of 0.399 and weighted average of 16.4%, a difference of 84.7%.
Unemployment Among Women with Children Ages 6 to 17 years Correlation Summary
| Measurement | Immigrants from Greece | Cheyenne |
| Minimum | 1.4% | 5.0% |
| Maximum | 27.6% | 76.9% |
| Range | 26.2% | 71.9% |
| Mean | 11.0% | 33.8% |
| Median | 8.9% | 33.3% |
| Interquartile 25% (IQ1) | 7.7% | 15.4% |
| Interquartile 75% (IQ3) | 12.8% | 50.0% |
| Interquartile Range (IQR) | 5.1% | 34.6% |
| Standard Deviation (Sample) | 5.9% | 20.3% |
| Standard Deviation (Population) | 5.9% | 19.6% |
Similar Demographics by Unemployment Among Women with Children Ages 6 to 17 years
Demographics Similar to Immigrants from Greece by Unemployment Among Women with Children Ages 6 to 17 years
In terms of unemployment among women with children ages 6 to 17 years, the demographic groups most similar to Immigrants from Greece are Vietnamese (8.9%, a difference of 0.020%), Immigrants from Europe (8.9%, a difference of 0.090%), Immigrants from Eastern Africa (8.9%, a difference of 0.16%), Immigrants from Northern Europe (8.9%, a difference of 0.16%), and Greek (8.9%, a difference of 0.20%).
| Demographics | Rating | Rank | Unemployment Among Women with Children Ages 6 to 17 years |
| Costa Ricans | 77.0 /100 | #148 | Good 8.8% |
| Croatians | 76.0 /100 | #149 | Good 8.8% |
| Greeks | 75.2 /100 | #150 | Good 8.9% |
| Immigrants | Eastern Africa | 74.6 /100 | #151 | Good 8.9% |
| Immigrants | Northern Europe | 74.6 /100 | #152 | Good 8.9% |
| Immigrants | Europe | 73.4 /100 | #153 | Good 8.9% |
| Vietnamese | 72.1 /100 | #154 | Good 8.9% |
| Immigrants | Greece | 71.8 /100 | #155 | Good 8.9% |
| Osage | 65.9 /100 | #156 | Good 8.9% |
| Immigrants | Belgium | 65.6 /100 | #157 | Good 8.9% |
| Immigrants | Chile | 65.3 /100 | #158 | Good 8.9% |
| Spanish | 63.8 /100 | #159 | Good 8.9% |
| Immigrants | Hungary | 63.4 /100 | #160 | Good 8.9% |
| Immigrants | Guyana | 63.0 /100 | #161 | Good 8.9% |
| Immigrants | Netherlands | 60.8 /100 | #162 | Good 8.9% |
Demographics Similar to Cheyenne by Unemployment Among Women with Children Ages 6 to 17 years
In terms of unemployment among women with children ages 6 to 17 years, the demographic groups most similar to Cheyenne are Arapaho (16.8%, a difference of 2.9%), Inupiat (14.9%, a difference of 10.3%), Yuman (14.8%, a difference of 10.6%), Yup'ik (18.6%, a difference of 13.6%), and Pima (18.9%, a difference of 15.2%).
| Demographics | Rating | Rank | Unemployment Among Women with Children Ages 6 to 17 years |
| Natives/Alaskans | 0.0 /100 | #333 | Tragic 11.5% |
| Ugandans | 0.0 /100 | #334 | Tragic 12.0% |
| Colville | 0.0 /100 | #335 | Tragic 12.3% |
| Houma | 0.0 /100 | #336 | Tragic 12.5% |
| Immigrants | Yemen | 0.0 /100 | #337 | Tragic 12.7% |
| Hopi | 0.0 /100 | #338 | Tragic 12.9% |
| Sioux | 0.0 /100 | #339 | Tragic 13.2% |
| Puerto Ricans | 0.0 /100 | #340 | Tragic 13.9% |
| Navajo | 0.0 /100 | #341 | Tragic 14.2% |
| Yuman | 0.0 /100 | #342 | Tragic 14.8% |
| Inupiat | 0.0 /100 | #343 | Tragic 14.9% |
| Cheyenne | 0.0 /100 | #344 | Tragic 16.4% |
| Arapaho | 0.0 /100 | #345 | Tragic 16.8% |
| Yup'ik | 0.0 /100 | #346 | Tragic 18.6% |
| Pima | 0.0 /100 | #347 | Tragic 18.9% |