Immigrants from Ethiopia vs Pueblo Unemployment Among Women with Children Under 6 years
COMPARE
Immigrants from Ethiopia
Pueblo
Unemployment Among Women with Children Under 6 years
Unemployment Among Women with Children Under 6 years Comparison
Immigrants from Ethiopia
Pueblo
6.9%
UNEMPLOYMENT AMONG WOMEN WITH CHILDREN UNDER 6 YEARS
99.8/ 100
METRIC RATING
56th/ 347
METRIC RANK
9.1%
UNEMPLOYMENT AMONG WOMEN WITH CHILDREN UNDER 6 YEARS
0.0/ 100
METRIC RATING
306th/ 347
METRIC RANK
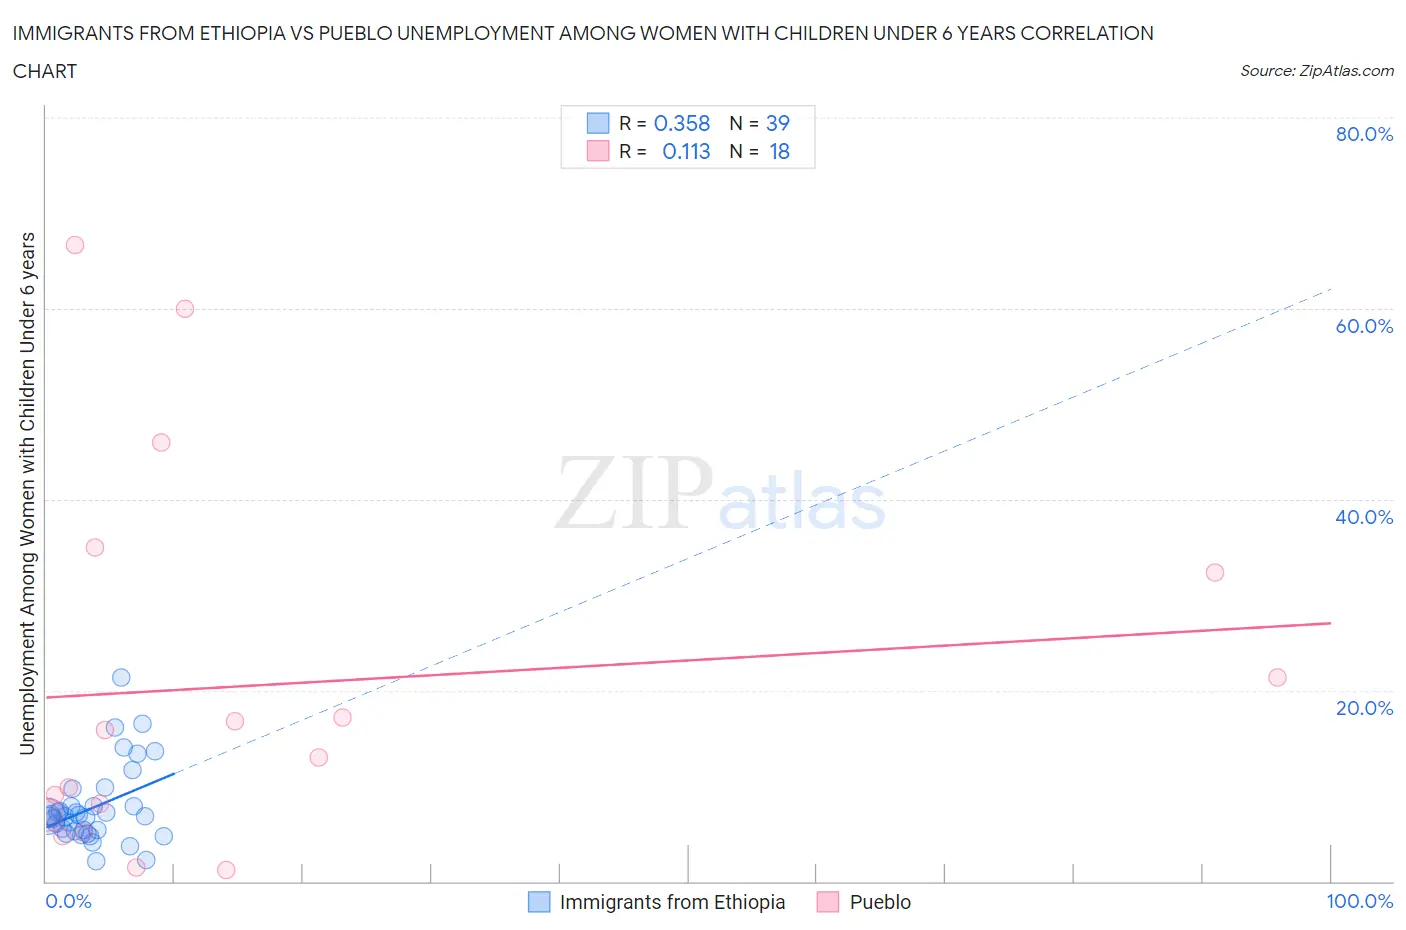
Immigrants from Ethiopia vs Pueblo Unemployment Among Women with Children Under 6 years Correlation Chart
The statistical analysis conducted on geographies consisting of 180,200,424 people shows a mild positive correlation between the proportion of Immigrants from Ethiopia and unemployment rate among women with children under the age of 6 in the United States with a correlation coefficient (R) of 0.358 and weighted average of 6.9%. Similarly, the statistical analysis conducted on geographies consisting of 107,371,910 people shows a poor positive correlation between the proportion of Pueblo and unemployment rate among women with children under the age of 6 in the United States with a correlation coefficient (R) of 0.113 and weighted average of 9.1%, a difference of 33.0%.
Unemployment Among Women with Children Under 6 years Correlation Summary
| Measurement | Immigrants from Ethiopia | Pueblo |
| Minimum | 2.1% | 1.2% |
| Maximum | 21.4% | 66.7% |
| Range | 19.3% | 65.5% |
| Mean | 7.8% | 20.6% |
| Median | 6.8% | 14.4% |
| Interquartile 25% (IQ1) | 5.3% | 7.0% |
| Interquartile 75% (IQ3) | 7.9% | 32.3% |
| Interquartile Range (IQR) | 2.6% | 25.3% |
| Standard Deviation (Sample) | 4.1% | 19.7% |
| Standard Deviation (Population) | 4.0% | 19.1% |
Similar Demographics by Unemployment Among Women with Children Under 6 years
Demographics Similar to Immigrants from Ethiopia by Unemployment Among Women with Children Under 6 years
In terms of unemployment among women with children under 6 years, the demographic groups most similar to Immigrants from Ethiopia are Icelander (6.9%, a difference of 0.010%), Immigrants from Ukraine (6.8%, a difference of 0.10%), Immigrants from Turkey (6.9%, a difference of 0.23%), Immigrants from Serbia (6.9%, a difference of 0.30%), and Immigrants from Sri Lanka (6.9%, a difference of 0.38%).
| Demographics | Rating | Rank | Unemployment Among Women with Children Under 6 years |
| Immigrants | Nepal | 99.9 /100 | #49 | Exceptional 6.8% |
| Immigrants | Ireland | 99.9 /100 | #50 | Exceptional 6.8% |
| Ethiopians | 99.9 /100 | #51 | Exceptional 6.8% |
| Immigrants | Iran | 99.9 /100 | #52 | Exceptional 6.8% |
| Chinese | 99.9 /100 | #53 | Exceptional 6.8% |
| Immigrants | Latvia | 99.9 /100 | #54 | Exceptional 6.8% |
| Immigrants | Ukraine | 99.8 /100 | #55 | Exceptional 6.8% |
| Immigrants | Ethiopia | 99.8 /100 | #56 | Exceptional 6.9% |
| Icelanders | 99.8 /100 | #57 | Exceptional 6.9% |
| Immigrants | Turkey | 99.8 /100 | #58 | Exceptional 6.9% |
| Immigrants | Serbia | 99.8 /100 | #59 | Exceptional 6.9% |
| Immigrants | Sri Lanka | 99.8 /100 | #60 | Exceptional 6.9% |
| Immigrants | France | 99.7 /100 | #61 | Exceptional 6.9% |
| Somalis | 99.7 /100 | #62 | Exceptional 6.9% |
| Maltese | 99.7 /100 | #63 | Exceptional 6.9% |
Demographics Similar to Pueblo by Unemployment Among Women with Children Under 6 years
In terms of unemployment among women with children under 6 years, the demographic groups most similar to Pueblo are Dominican (9.1%, a difference of 0.12%), Alaskan Athabascan (9.1%, a difference of 0.17%), Immigrants from Micronesia (9.1%, a difference of 0.18%), Immigrants from Mexico (9.1%, a difference of 0.58%), and African (9.2%, a difference of 0.58%).
| Demographics | Rating | Rank | Unemployment Among Women with Children Under 6 years |
| Immigrants | Jamaica | 0.0 /100 | #299 | Tragic 8.9% |
| Creek | 0.0 /100 | #300 | Tragic 8.9% |
| Chickasaw | 0.0 /100 | #301 | Tragic 9.0% |
| Hispanics or Latinos | 0.0 /100 | #302 | Tragic 9.0% |
| Immigrants | West Indies | 0.0 /100 | #303 | Tragic 9.0% |
| Immigrants | Mexico | 0.0 /100 | #304 | Tragic 9.1% |
| Alaskan Athabascans | 0.0 /100 | #305 | Tragic 9.1% |
| Pueblo | 0.0 /100 | #306 | Tragic 9.1% |
| Dominicans | 0.0 /100 | #307 | Tragic 9.1% |
| Immigrants | Micronesia | 0.0 /100 | #308 | Tragic 9.1% |
| Africans | 0.0 /100 | #309 | Tragic 9.2% |
| Cajuns | 0.0 /100 | #310 | Tragic 9.2% |
| French American Indians | 0.0 /100 | #311 | Tragic 9.2% |
| Immigrants | Azores | 0.0 /100 | #312 | Tragic 9.2% |
| Americans | 0.0 /100 | #313 | Tragic 9.3% |