Choctaw vs Pueblo Unemployment Among Women with Children Under 6 years
COMPARE
Choctaw
Pueblo
Unemployment Among Women with Children Under 6 years
Unemployment Among Women with Children Under 6 years Comparison
Choctaw
Pueblo
9.8%
UNEMPLOYMENT AMONG WOMEN WITH CHILDREN UNDER 6 YEARS
0.0/ 100
METRIC RATING
325th/ 347
METRIC RANK
9.1%
UNEMPLOYMENT AMONG WOMEN WITH CHILDREN UNDER 6 YEARS
0.0/ 100
METRIC RATING
306th/ 347
METRIC RANK
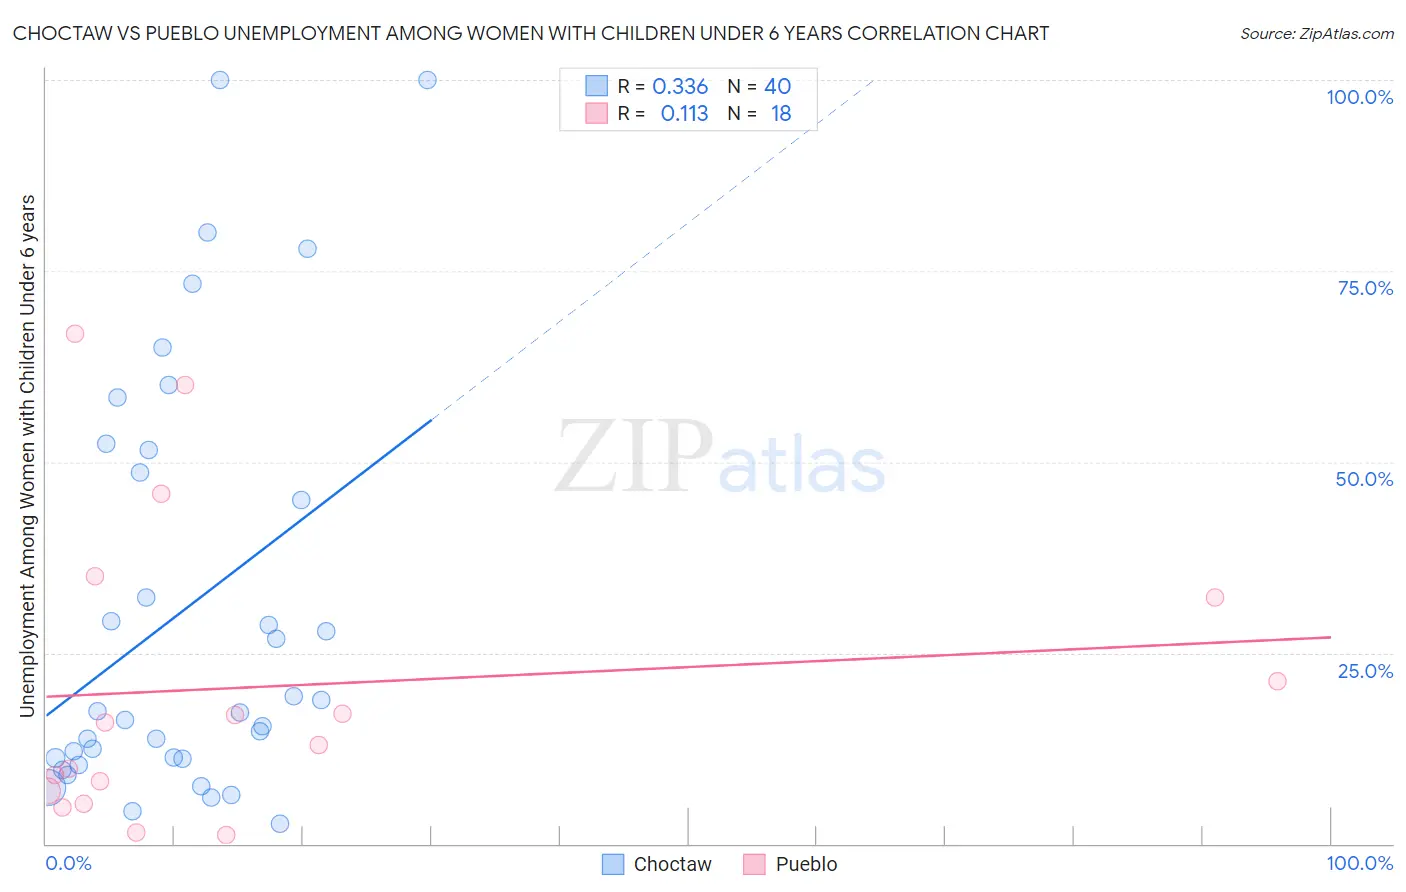
Choctaw vs Pueblo Unemployment Among Women with Children Under 6 years Correlation Chart
The statistical analysis conducted on geographies consisting of 218,001,226 people shows a mild positive correlation between the proportion of Choctaw and unemployment rate among women with children under the age of 6 in the United States with a correlation coefficient (R) of 0.336 and weighted average of 9.8%. Similarly, the statistical analysis conducted on geographies consisting of 107,371,910 people shows a poor positive correlation between the proportion of Pueblo and unemployment rate among women with children under the age of 6 in the United States with a correlation coefficient (R) of 0.113 and weighted average of 9.1%, a difference of 7.4%.
Unemployment Among Women with Children Under 6 years Correlation Summary
| Measurement | Choctaw | Pueblo |
| Minimum | 2.6% | 1.2% |
| Maximum | 100.0% | 66.7% |
| Range | 97.4% | 65.5% |
| Mean | 30.6% | 20.6% |
| Median | 17.3% | 14.4% |
| Interquartile 25% (IQ1) | 11.2% | 7.0% |
| Interquartile 75% (IQ3) | 50.1% | 32.3% |
| Interquartile Range (IQR) | 38.9% | 25.3% |
| Standard Deviation (Sample) | 27.3% | 19.7% |
| Standard Deviation (Population) | 27.0% | 19.1% |
Demographics Similar to Choctaw and Pueblo by Unemployment Among Women with Children Under 6 years
In terms of unemployment among women with children under 6 years, the demographic groups most similar to Choctaw are Paiute (9.7%, a difference of 0.95%), Immigrants from Bahamas (9.6%, a difference of 1.7%), Alaska Native (9.6%, a difference of 1.8%), Central American Indian (9.6%, a difference of 2.1%), and Potawatomi (9.6%, a difference of 2.2%). Similarly, the demographic groups most similar to Pueblo are Dominican (9.1%, a difference of 0.12%), Alaskan Athabascan (9.1%, a difference of 0.17%), Immigrants from Micronesia (9.1%, a difference of 0.18%), African (9.2%, a difference of 0.58%), and Cajun (9.2%, a difference of 0.71%).
| Demographics | Rating | Rank | Unemployment Among Women with Children Under 6 years |
| Alaskan Athabascans | 0.0 /100 | #305 | Tragic 9.1% |
| Pueblo | 0.0 /100 | #306 | Tragic 9.1% |
| Dominicans | 0.0 /100 | #307 | Tragic 9.1% |
| Immigrants | Micronesia | 0.0 /100 | #308 | Tragic 9.1% |
| Africans | 0.0 /100 | #309 | Tragic 9.2% |
| Cajuns | 0.0 /100 | #310 | Tragic 9.2% |
| French American Indians | 0.0 /100 | #311 | Tragic 9.2% |
| Immigrants | Azores | 0.0 /100 | #312 | Tragic 9.2% |
| Americans | 0.0 /100 | #313 | Tragic 9.3% |
| Fijians | 0.0 /100 | #314 | Tragic 9.3% |
| Cherokee | 0.0 /100 | #315 | Tragic 9.3% |
| Houma | 0.0 /100 | #316 | Tragic 9.4% |
| Dutch West Indians | 0.0 /100 | #317 | Tragic 9.5% |
| Osage | 0.0 /100 | #318 | Tragic 9.5% |
| Marshallese | 0.0 /100 | #319 | Tragic 9.6% |
| Potawatomi | 0.0 /100 | #320 | Tragic 9.6% |
| Central American Indians | 0.0 /100 | #321 | Tragic 9.6% |
| Alaska Natives | 0.0 /100 | #322 | Tragic 9.6% |
| Immigrants | Bahamas | 0.0 /100 | #323 | Tragic 9.6% |
| Paiute | 0.0 /100 | #324 | Tragic 9.7% |
| Choctaw | 0.0 /100 | #325 | Tragic 9.8% |