Immigrants from England vs Celtic Unemployment
COMPARE
Immigrants from England
Celtic
Unemployment
Unemployment Comparison
Immigrants from England
Celtics
5.0%
UNEMPLOYMENT
95.2/ 100
METRIC RATING
96th/ 347
METRIC RANK
4.9%
UNEMPLOYMENT
99.1/ 100
METRIC RATING
56th/ 347
METRIC RANK
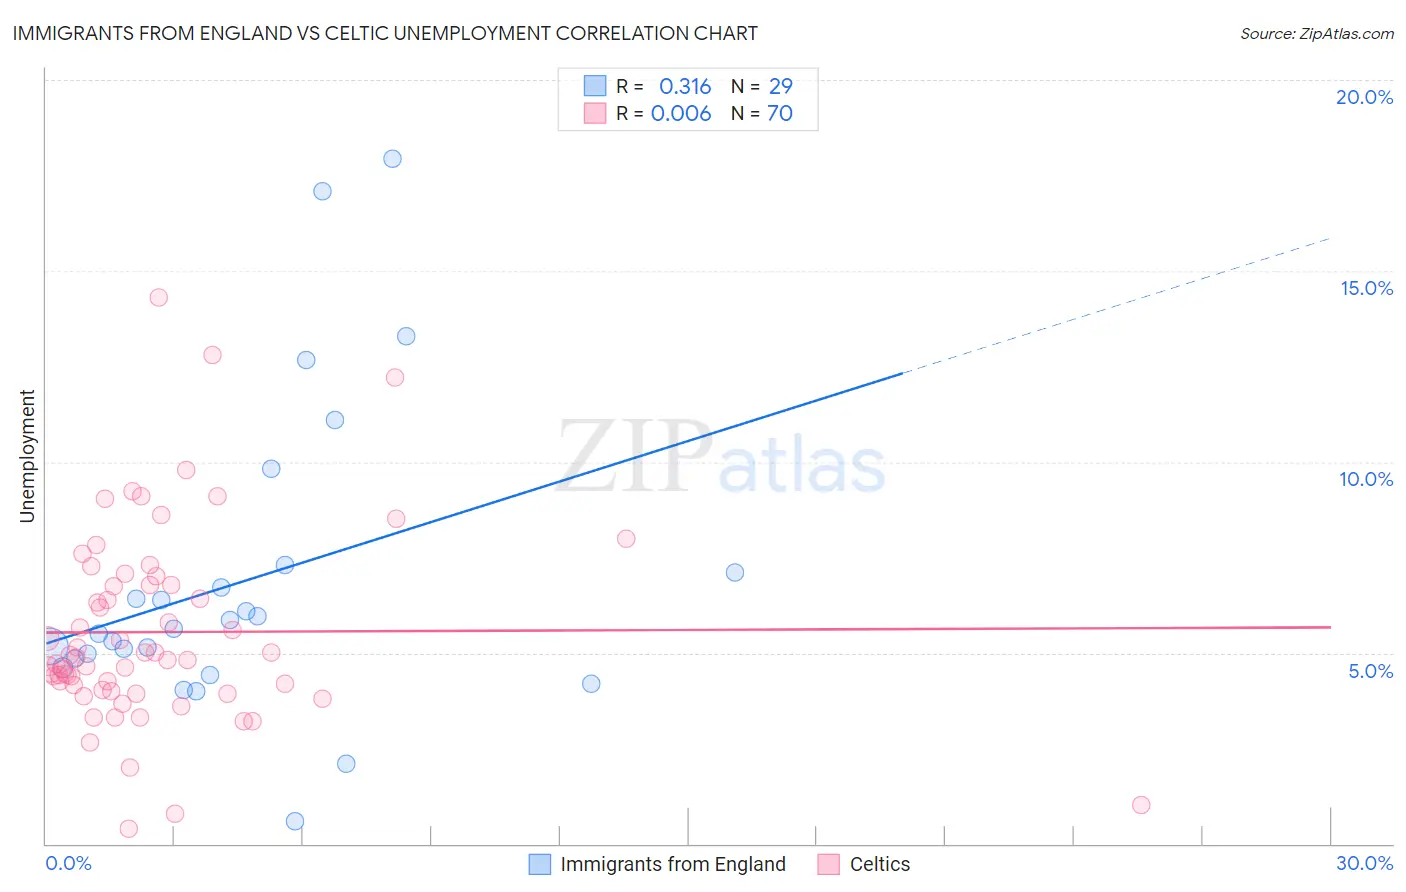
Immigrants from England vs Celtic Unemployment Correlation Chart
The statistical analysis conducted on geographies consisting of 391,444,946 people shows a mild positive correlation between the proportion of Immigrants from England and unemployment in the United States with a correlation coefficient (R) of 0.316 and weighted average of 5.0%. Similarly, the statistical analysis conducted on geographies consisting of 168,747,363 people shows no correlation between the proportion of Celtics and unemployment in the United States with a correlation coefficient (R) of 0.006 and weighted average of 4.9%, a difference of 2.8%.
Unemployment Correlation Summary
| Measurement | Immigrants from England | Celtic |
| Minimum | 0.60% | 0.40% |
| Maximum | 17.9% | 14.3% |
| Range | 17.3% | 13.9% |
| Mean | 6.9% | 5.5% |
| Median | 5.6% | 4.8% |
| Interquartile 25% (IQ1) | 4.7% | 4.0% |
| Interquartile 75% (IQ3) | 7.2% | 6.8% |
| Interquartile Range (IQR) | 2.5% | 2.8% |
| Standard Deviation (Sample) | 4.0% | 2.6% |
| Standard Deviation (Population) | 3.9% | 2.6% |
Similar Demographics by Unemployment
Demographics Similar to Immigrants from England by Unemployment
In terms of unemployment, the demographic groups most similar to Immigrants from England are Immigrants from Czechoslovakia (5.0%, a difference of 0.030%), Romanian (5.0%, a difference of 0.060%), Mongolian (5.0%, a difference of 0.13%), Immigrants from Serbia (5.0%, a difference of 0.16%), and Estonian (5.0%, a difference of 0.19%).
| Demographics | Rating | Rank | Unemployment |
| Jordanians | 96.4 /100 | #89 | Exceptional 5.0% |
| Immigrants | North Macedonia | 96.3 /100 | #90 | Exceptional 5.0% |
| Immigrants | Sudan | 96.3 /100 | #91 | Exceptional 5.0% |
| Immigrants | South Africa | 96.2 /100 | #92 | Exceptional 5.0% |
| Ukrainians | 96.0 /100 | #93 | Exceptional 5.0% |
| Immigrants | Austria | 95.9 /100 | #94 | Exceptional 5.0% |
| Immigrants | Serbia | 95.6 /100 | #95 | Exceptional 5.0% |
| Immigrants | England | 95.2 /100 | #96 | Exceptional 5.0% |
| Immigrants | Czechoslovakia | 95.1 /100 | #97 | Exceptional 5.0% |
| Romanians | 95.0 /100 | #98 | Exceptional 5.0% |
| Mongolians | 94.8 /100 | #99 | Exceptional 5.0% |
| Estonians | 94.6 /100 | #100 | Exceptional 5.0% |
| Americans | 94.3 /100 | #101 | Exceptional 5.0% |
| Immigrants | Argentina | 94.1 /100 | #102 | Exceptional 5.0% |
| Chickasaw | 94.0 /100 | #103 | Exceptional 5.0% |
Demographics Similar to Celtics by Unemployment
In terms of unemployment, the demographic groups most similar to Celtics are Immigrants from Singapore (4.9%, a difference of 0.070%), Australian (4.9%, a difference of 0.16%), Greek (4.9%, a difference of 0.17%), Eastern European (4.9%, a difference of 0.19%), and Bhutanese (4.9%, a difference of 0.20%).
| Demographics | Rating | Rank | Unemployment |
| Immigrants | South Central Asia | 99.3 /100 | #49 | Exceptional 4.9% |
| French Canadians | 99.3 /100 | #50 | Exceptional 4.9% |
| Immigrants | Belgium | 99.2 /100 | #51 | Exceptional 4.9% |
| Whites/Caucasians | 99.2 /100 | #52 | Exceptional 4.9% |
| Immigrants | Zimbabwe | 99.2 /100 | #53 | Exceptional 4.9% |
| Eastern Europeans | 99.2 /100 | #54 | Exceptional 4.9% |
| Australians | 99.2 /100 | #55 | Exceptional 4.9% |
| Celtics | 99.1 /100 | #56 | Exceptional 4.9% |
| Immigrants | Singapore | 99.1 /100 | #57 | Exceptional 4.9% |
| Greeks | 99.0 /100 | #58 | Exceptional 4.9% |
| Bhutanese | 99.0 /100 | #59 | Exceptional 4.9% |
| Immigrants | Netherlands | 99.0 /100 | #60 | Exceptional 4.9% |
| Cambodians | 99.0 /100 | #61 | Exceptional 4.9% |
| Icelanders | 98.9 /100 | #62 | Exceptional 4.9% |
| Immigrants | Bulgaria | 98.9 /100 | #63 | Exceptional 4.9% |