Immigrants from Egypt vs Puget Sound Salish Unemployment Among Ages 25 to 29 years
COMPARE
Immigrants from Egypt
Puget Sound Salish
Unemployment Among Ages 25 to 29 years
Unemployment Among Ages 25 to 29 years Comparison
Immigrants from Egypt
Puget Sound Salish
6.5%
UNEMPLOYMENT AMONG AGES 25 TO 29 YEARS
87.1/ 100
METRIC RATING
113th/ 347
METRIC RANK
7.1%
UNEMPLOYMENT AMONG AGES 25 TO 29 YEARS
1.8/ 100
METRIC RATING
237th/ 347
METRIC RANK
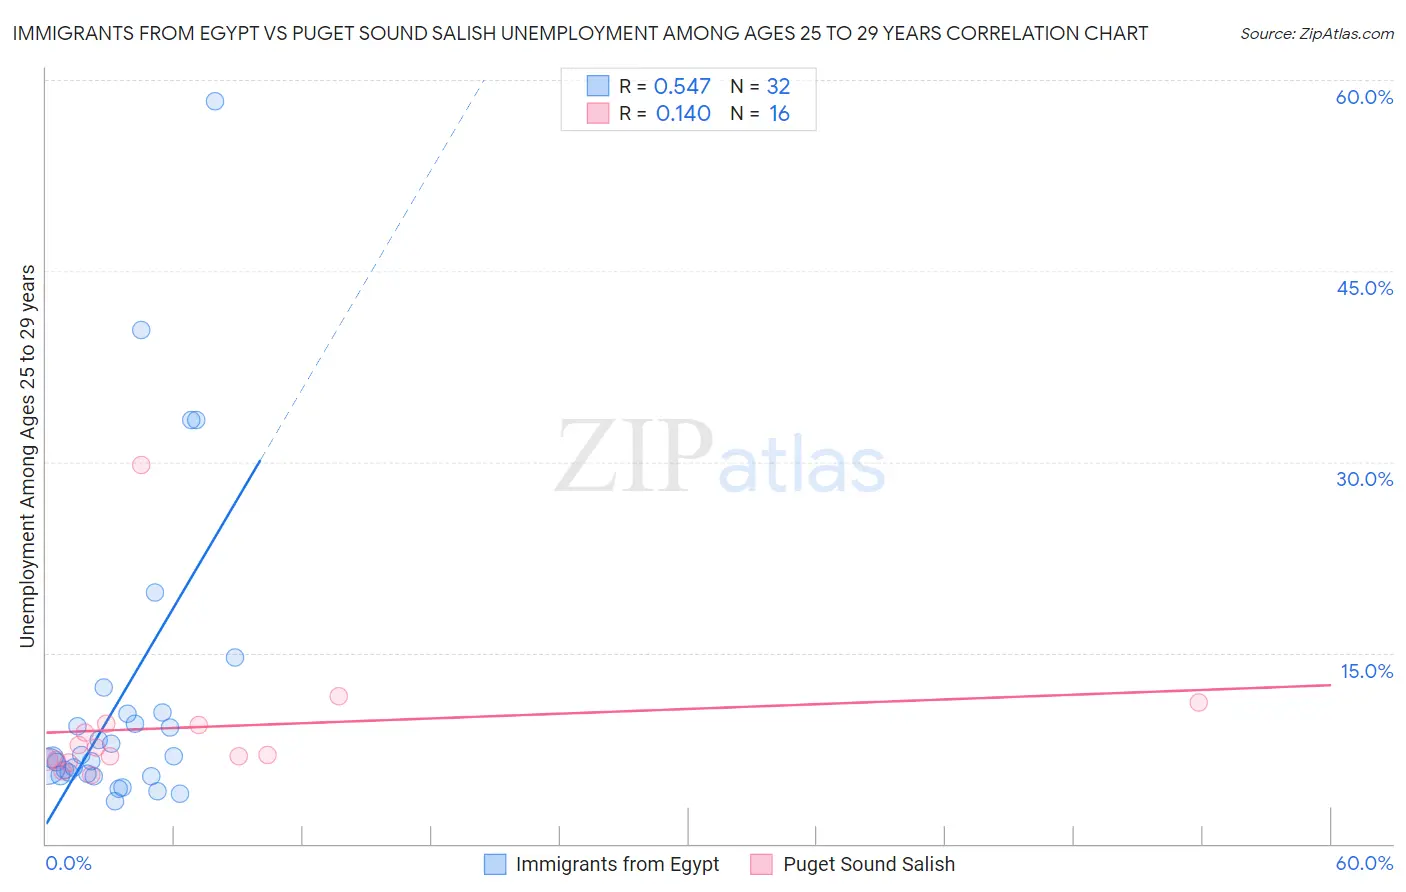
Immigrants from Egypt vs Puget Sound Salish Unemployment Among Ages 25 to 29 years Correlation Chart
The statistical analysis conducted on geographies consisting of 239,151,709 people shows a substantial positive correlation between the proportion of Immigrants from Egypt and unemployment rate among population between the ages 25 and 29 in the United States with a correlation coefficient (R) of 0.547 and weighted average of 6.5%. Similarly, the statistical analysis conducted on geographies consisting of 45,327,294 people shows a poor positive correlation between the proportion of Puget Sound Salish and unemployment rate among population between the ages 25 and 29 in the United States with a correlation coefficient (R) of 0.140 and weighted average of 7.1%, a difference of 9.3%.
Unemployment Among Ages 25 to 29 years Correlation Summary
| Measurement | Immigrants from Egypt | Puget Sound Salish |
| Minimum | 3.3% | 5.4% |
| Maximum | 58.3% | 29.7% |
| Range | 55.0% | 24.4% |
| Mean | 11.7% | 9.2% |
| Median | 6.8% | 7.3% |
| Interquartile 25% (IQ1) | 5.5% | 6.6% |
| Interquartile 75% (IQ3) | 10.2% | 9.4% |
| Interquartile Range (IQR) | 4.8% | 2.8% |
| Standard Deviation (Sample) | 12.4% | 5.8% |
| Standard Deviation (Population) | 12.2% | 5.6% |
Similar Demographics by Unemployment Among Ages 25 to 29 years
Demographics Similar to Immigrants from Egypt by Unemployment Among Ages 25 to 29 years
In terms of unemployment among ages 25 to 29 years, the demographic groups most similar to Immigrants from Egypt are Immigrants from Nicaragua (6.4%, a difference of 0.050%), Immigrants from Colombia (6.4%, a difference of 0.070%), European (6.4%, a difference of 0.11%), German (6.5%, a difference of 0.11%), and Immigrants from Albania (6.4%, a difference of 0.12%).
| Demographics | Rating | Rank | Unemployment Among Ages 25 to 29 years |
| Immigrants | Hungary | 89.4 /100 | #106 | Excellent 6.4% |
| Swiss | 88.6 /100 | #107 | Excellent 6.4% |
| Croatians | 88.2 /100 | #108 | Excellent 6.4% |
| Immigrants | Albania | 87.9 /100 | #109 | Excellent 6.4% |
| Europeans | 87.8 /100 | #110 | Excellent 6.4% |
| Immigrants | Colombia | 87.6 /100 | #111 | Excellent 6.4% |
| Immigrants | Nicaragua | 87.5 /100 | #112 | Excellent 6.4% |
| Immigrants | Egypt | 87.1 /100 | #113 | Excellent 6.5% |
| Germans | 86.3 /100 | #114 | Excellent 6.5% |
| Macedonians | 86.1 /100 | #115 | Excellent 6.5% |
| Pakistanis | 85.9 /100 | #116 | Excellent 6.5% |
| Immigrants | Uruguay | 85.7 /100 | #117 | Excellent 6.5% |
| Chileans | 85.3 /100 | #118 | Excellent 6.5% |
| Immigrants | South Africa | 84.9 /100 | #119 | Excellent 6.5% |
| Immigrants | Moldova | 84.5 /100 | #120 | Excellent 6.5% |
Demographics Similar to Puget Sound Salish by Unemployment Among Ages 25 to 29 years
In terms of unemployment among ages 25 to 29 years, the demographic groups most similar to Puget Sound Salish are Honduran (7.1%, a difference of 0.020%), Cape Verdean (7.0%, a difference of 0.070%), Panamanian (7.0%, a difference of 0.21%), French Canadian (7.0%, a difference of 0.37%), and Immigrants from Honduras (7.0%, a difference of 0.39%).
| Demographics | Rating | Rank | Unemployment Among Ages 25 to 29 years |
| Immigrants | El Salvador | 3.6 /100 | #230 | Tragic 7.0% |
| Central Americans | 3.0 /100 | #231 | Tragic 7.0% |
| Spanish Americans | 2.7 /100 | #232 | Tragic 7.0% |
| Immigrants | Honduras | 2.4 /100 | #233 | Tragic 7.0% |
| French Canadians | 2.4 /100 | #234 | Tragic 7.0% |
| Panamanians | 2.1 /100 | #235 | Tragic 7.0% |
| Cape Verdeans | 1.9 /100 | #236 | Tragic 7.0% |
| Puget Sound Salish | 1.8 /100 | #237 | Tragic 7.1% |
| Hondurans | 1.8 /100 | #238 | Tragic 7.1% |
| Potawatomi | 1.3 /100 | #239 | Tragic 7.1% |
| Native Hawaiians | 1.3 /100 | #240 | Tragic 7.1% |
| Immigrants | Sierra Leone | 1.3 /100 | #241 | Tragic 7.1% |
| Spanish American Indians | 1.1 /100 | #242 | Tragic 7.1% |
| Yaqui | 1.0 /100 | #243 | Tragic 7.1% |
| Immigrants | Nonimmigrants | 0.9 /100 | #244 | Tragic 7.1% |