Immigrants from Egypt vs Immigrants from Europe Unemployment Among Ages 25 to 29 years
COMPARE
Immigrants from Egypt
Immigrants from Europe
Unemployment Among Ages 25 to 29 years
Unemployment Among Ages 25 to 29 years Comparison
Immigrants from Egypt
Immigrants from Europe
6.5%
UNEMPLOYMENT AMONG AGES 25 TO 29 YEARS
87.1/ 100
METRIC RATING
113th/ 347
METRIC RANK
6.5%
UNEMPLOYMENT AMONG AGES 25 TO 29 YEARS
75.7/ 100
METRIC RATING
133rd/ 347
METRIC RANK
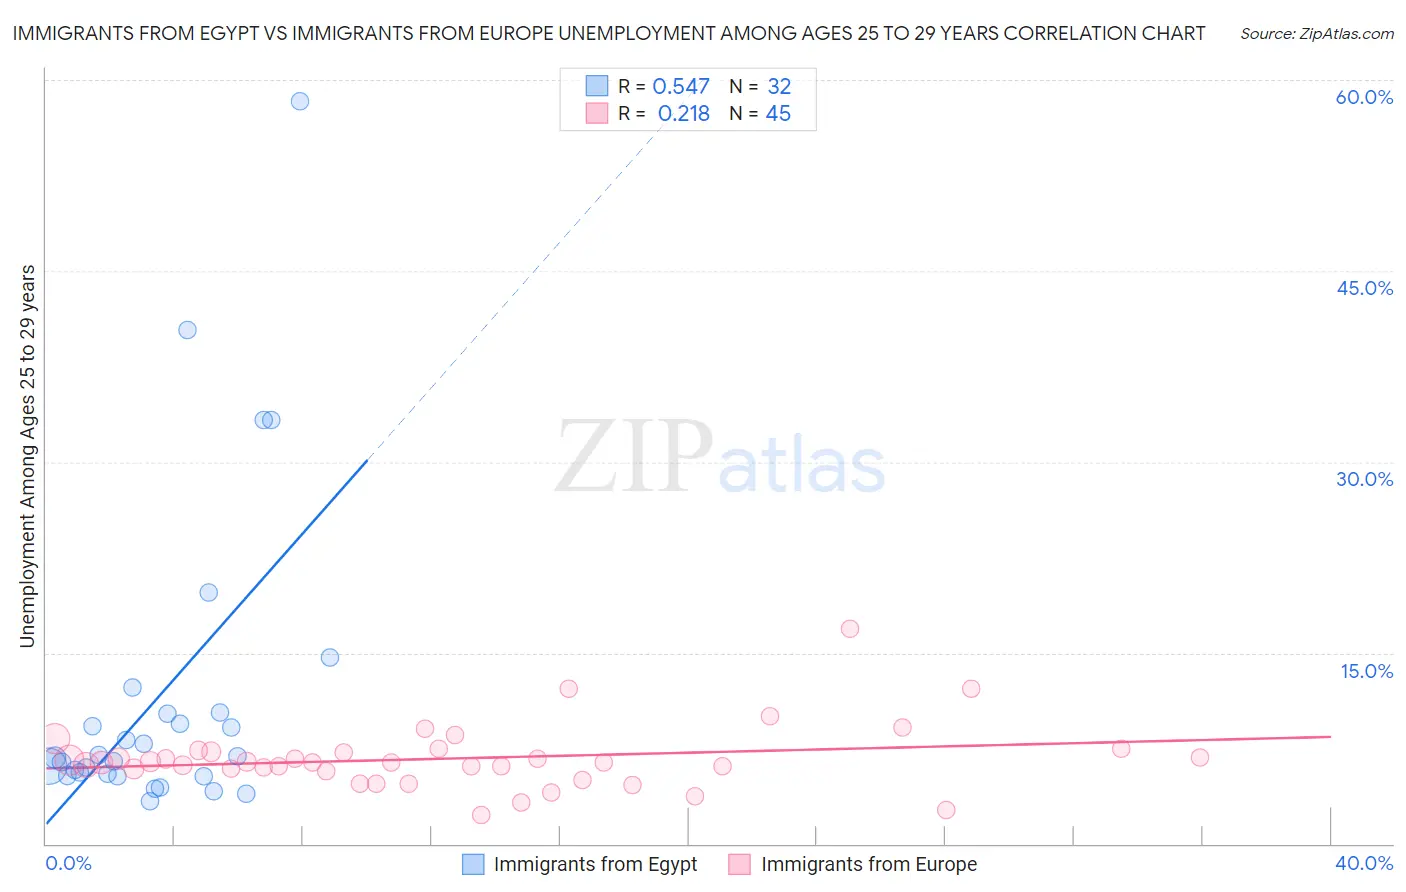
Immigrants from Egypt vs Immigrants from Europe Unemployment Among Ages 25 to 29 years Correlation Chart
The statistical analysis conducted on geographies consisting of 239,151,709 people shows a substantial positive correlation between the proportion of Immigrants from Egypt and unemployment rate among population between the ages 25 and 29 in the United States with a correlation coefficient (R) of 0.547 and weighted average of 6.5%. Similarly, the statistical analysis conducted on geographies consisting of 495,238,580 people shows a weak positive correlation between the proportion of Immigrants from Europe and unemployment rate among population between the ages 25 and 29 in the United States with a correlation coefficient (R) of 0.218 and weighted average of 6.5%, a difference of 1.2%.
Unemployment Among Ages 25 to 29 years Correlation Summary
| Measurement | Immigrants from Egypt | Immigrants from Europe |
| Minimum | 3.3% | 2.2% |
| Maximum | 58.3% | 16.9% |
| Range | 55.0% | 14.7% |
| Mean | 11.7% | 6.7% |
| Median | 6.8% | 6.4% |
| Interquartile 25% (IQ1) | 5.5% | 5.8% |
| Interquartile 75% (IQ3) | 10.2% | 7.3% |
| Interquartile Range (IQR) | 4.8% | 1.5% |
| Standard Deviation (Sample) | 12.4% | 2.5% |
| Standard Deviation (Population) | 12.2% | 2.5% |
Demographics Similar to Immigrants from Egypt and Immigrants from Europe by Unemployment Among Ages 25 to 29 years
In terms of unemployment among ages 25 to 29 years, the demographic groups most similar to Immigrants from Egypt are German (6.5%, a difference of 0.11%), Macedonian (6.5%, a difference of 0.13%), Pakistani (6.5%, a difference of 0.17%), Immigrants from Uruguay (6.5%, a difference of 0.19%), and Chilean (6.5%, a difference of 0.24%). Similarly, the demographic groups most similar to Immigrants from Europe are Polish (6.5%, a difference of 0.080%), Immigrants from Afghanistan (6.5%, a difference of 0.31%), Immigrants from Peru (6.5%, a difference of 0.39%), Sri Lankan (6.5%, a difference of 0.42%), and Immigrants from Chile (6.5%, a difference of 0.44%).
| Demographics | Rating | Rank | Unemployment Among Ages 25 to 29 years |
| Immigrants | Egypt | 87.1 /100 | #113 | Excellent 6.5% |
| Germans | 86.3 /100 | #114 | Excellent 6.5% |
| Macedonians | 86.1 /100 | #115 | Excellent 6.5% |
| Pakistanis | 85.9 /100 | #116 | Excellent 6.5% |
| Immigrants | Uruguay | 85.7 /100 | #117 | Excellent 6.5% |
| Chileans | 85.3 /100 | #118 | Excellent 6.5% |
| Immigrants | South Africa | 84.9 /100 | #119 | Excellent 6.5% |
| Immigrants | Moldova | 84.5 /100 | #120 | Excellent 6.5% |
| Immigrants | Uganda | 84.5 /100 | #121 | Excellent 6.5% |
| Immigrants | Belarus | 83.7 /100 | #122 | Excellent 6.5% |
| Laotians | 83.6 /100 | #123 | Excellent 6.5% |
| Arabs | 82.5 /100 | #124 | Excellent 6.5% |
| Syrians | 82.1 /100 | #125 | Excellent 6.5% |
| Brazilians | 81.9 /100 | #126 | Excellent 6.5% |
| Dutch | 80.6 /100 | #127 | Excellent 6.5% |
| Immigrants | Chile | 80.5 /100 | #128 | Excellent 6.5% |
| Sri Lankans | 80.3 /100 | #129 | Excellent 6.5% |
| Immigrants | Peru | 79.9 /100 | #130 | Good 6.5% |
| Immigrants | Afghanistan | 79.2 /100 | #131 | Good 6.5% |
| Poles | 76.6 /100 | #132 | Good 6.5% |
| Immigrants | Europe | 75.7 /100 | #133 | Good 6.5% |