Immigrants from Egypt vs Hopi Unemployment Among Women with Children Ages 6 to 17 years
COMPARE
Immigrants from Egypt
Hopi
Unemployment Among Women with Children Ages 6 to 17 years
Unemployment Among Women with Children Ages 6 to 17 years Comparison
Immigrants from Egypt
Hopi
8.7%
UNEMPLOYMENT AMONG WOMEN WITH CHILDREN AGES 6 TO 17 YEARS
95.0/ 100
METRIC RATING
122nd/ 347
METRIC RANK
12.9%
UNEMPLOYMENT AMONG WOMEN WITH CHILDREN AGES 6 TO 17 YEARS
0.0/ 100
METRIC RATING
338th/ 347
METRIC RANK
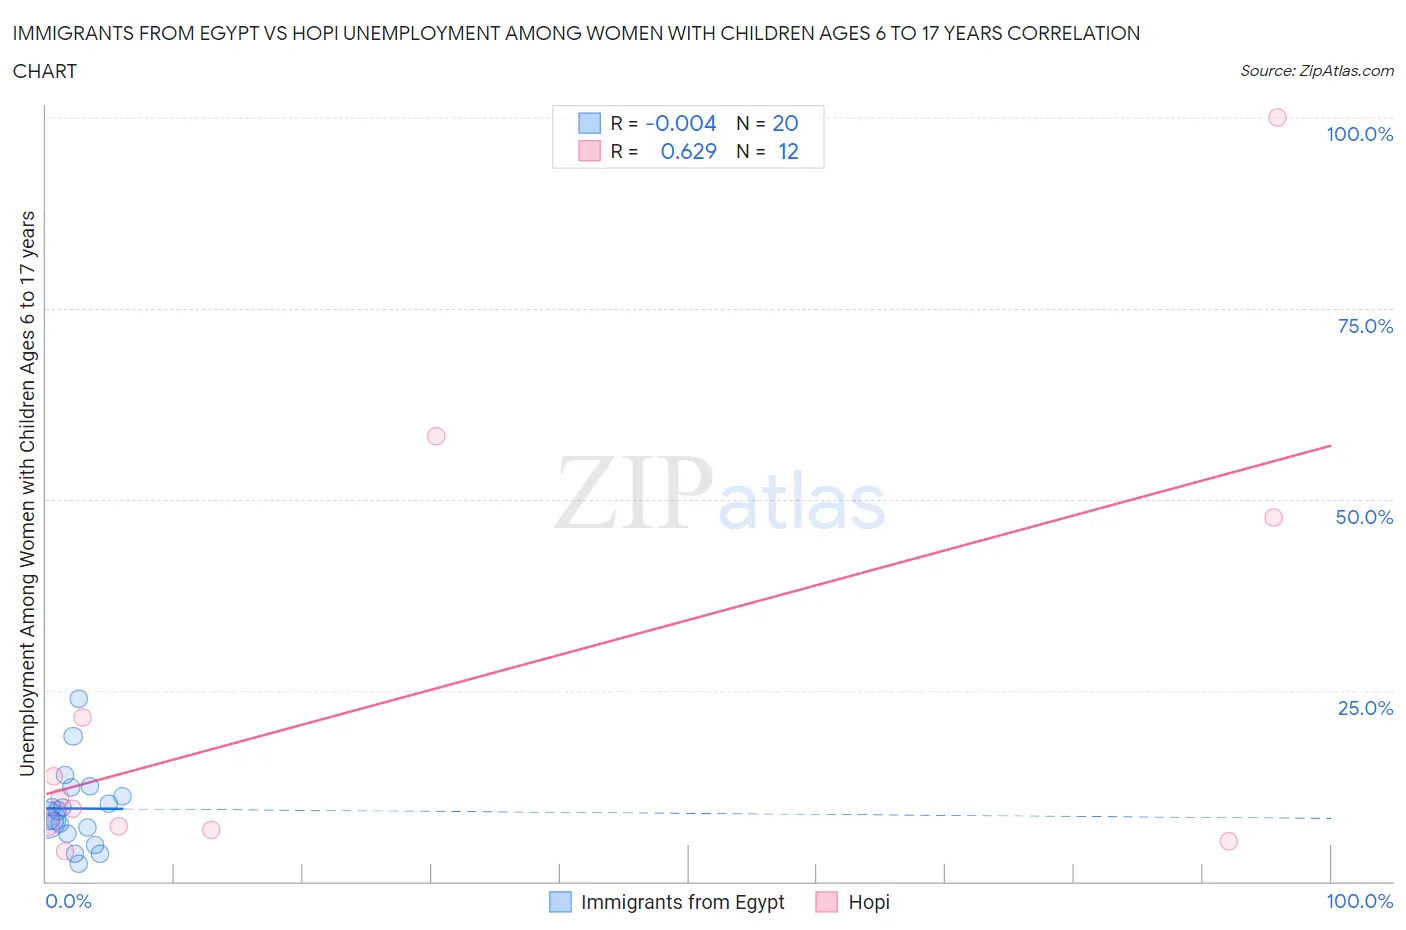
Immigrants from Egypt vs Hopi Unemployment Among Women with Children Ages 6 to 17 years Correlation Chart
The statistical analysis conducted on geographies consisting of 192,263,747 people shows no correlation between the proportion of Immigrants from Egypt and unemployment rate among women with children between the ages 6 and 17 in the United States with a correlation coefficient (R) of -0.004 and weighted average of 8.7%. Similarly, the statistical analysis conducted on geographies consisting of 67,793,249 people shows a significant positive correlation between the proportion of Hopi and unemployment rate among women with children between the ages 6 and 17 in the United States with a correlation coefficient (R) of 0.629 and weighted average of 12.9%, a difference of 48.7%.
Unemployment Among Women with Children Ages 6 to 17 years Correlation Summary
| Measurement | Immigrants from Egypt | Hopi |
| Minimum | 2.3% | 4.0% |
| Maximum | 23.8% | 100.0% |
| Range | 21.5% | 96.0% |
| Mean | 9.5% | 24.4% |
| Median | 8.7% | 10.2% |
| Interquartile 25% (IQ1) | 6.6% | 7.0% |
| Interquartile 75% (IQ3) | 11.7% | 34.5% |
| Interquartile Range (IQR) | 5.1% | 27.5% |
| Standard Deviation (Sample) | 5.2% | 29.5% |
| Standard Deviation (Population) | 5.0% | 28.3% |
Similar Demographics by Unemployment Among Women with Children Ages 6 to 17 years
Demographics Similar to Immigrants from Egypt by Unemployment Among Women with Children Ages 6 to 17 years
In terms of unemployment among women with children ages 6 to 17 years, the demographic groups most similar to Immigrants from Egypt are Immigrants from Morocco (8.7%, a difference of 0.040%), Immigrants from Lebanon (8.7%, a difference of 0.040%), South African (8.7%, a difference of 0.11%), Immigrants from Denmark (8.7%, a difference of 0.12%), and Immigrants from Northern Africa (8.7%, a difference of 0.13%).
| Demographics | Rating | Rank | Unemployment Among Women with Children Ages 6 to 17 years |
| Argentineans | 96.5 /100 | #115 | Exceptional 8.6% |
| Zimbabweans | 96.3 /100 | #116 | Exceptional 8.6% |
| Albanians | 96.3 /100 | #117 | Exceptional 8.6% |
| Pueblo | 96.2 /100 | #118 | Exceptional 8.6% |
| Immigrants | Grenada | 96.2 /100 | #119 | Exceptional 8.6% |
| Israelis | 95.9 /100 | #120 | Exceptional 8.7% |
| Immigrants | Denmark | 95.5 /100 | #121 | Exceptional 8.7% |
| Immigrants | Egypt | 95.0 /100 | #122 | Exceptional 8.7% |
| Immigrants | Morocco | 94.9 /100 | #123 | Exceptional 8.7% |
| Immigrants | Lebanon | 94.9 /100 | #124 | Exceptional 8.7% |
| South Africans | 94.6 /100 | #125 | Exceptional 8.7% |
| Immigrants | Northern Africa | 94.4 /100 | #126 | Exceptional 8.7% |
| Czechs | 94.4 /100 | #127 | Exceptional 8.7% |
| Hmong | 94.3 /100 | #128 | Exceptional 8.7% |
| Barbadians | 93.8 /100 | #129 | Exceptional 8.7% |
Demographics Similar to Hopi by Unemployment Among Women with Children Ages 6 to 17 years
In terms of unemployment among women with children ages 6 to 17 years, the demographic groups most similar to Hopi are Immigrants from Yemen (12.7%, a difference of 1.5%), Sioux (13.2%, a difference of 2.7%), Houma (12.5%, a difference of 3.4%), Colville (12.3%, a difference of 4.4%), and Ugandan (12.0%, a difference of 7.2%).
| Demographics | Rating | Rank | Unemployment Among Women with Children Ages 6 to 17 years |
| Blacks/African Americans | 0.0 /100 | #331 | Tragic 11.4% |
| Tsimshian | 0.0 /100 | #332 | Tragic 11.4% |
| Natives/Alaskans | 0.0 /100 | #333 | Tragic 11.5% |
| Ugandans | 0.0 /100 | #334 | Tragic 12.0% |
| Colville | 0.0 /100 | #335 | Tragic 12.3% |
| Houma | 0.0 /100 | #336 | Tragic 12.5% |
| Immigrants | Yemen | 0.0 /100 | #337 | Tragic 12.7% |
| Hopi | 0.0 /100 | #338 | Tragic 12.9% |
| Sioux | 0.0 /100 | #339 | Tragic 13.2% |
| Puerto Ricans | 0.0 /100 | #340 | Tragic 13.9% |
| Navajo | 0.0 /100 | #341 | Tragic 14.2% |
| Yuman | 0.0 /100 | #342 | Tragic 14.8% |
| Inupiat | 0.0 /100 | #343 | Tragic 14.9% |
| Cheyenne | 0.0 /100 | #344 | Tragic 16.4% |
| Arapaho | 0.0 /100 | #345 | Tragic 16.8% |