Immigrants from Eastern Africa vs Immigrants from Australia Unemployment Among Ages 20 to 24 years
COMPARE
Immigrants from Eastern Africa
Immigrants from Australia
Unemployment Among Ages 20 to 24 years
Unemployment Among Ages 20 to 24 years Comparison
Immigrants from Eastern Africa
Immigrants from Australia
9.5%
UNEMPLOYMENT AMONG AGES 20 TO 24 YEARS
100.0/ 100
METRIC RATING
31st/ 347
METRIC RANK
9.9%
UNEMPLOYMENT AMONG AGES 20 TO 24 YEARS
98.6/ 100
METRIC RATING
75th/ 347
METRIC RANK
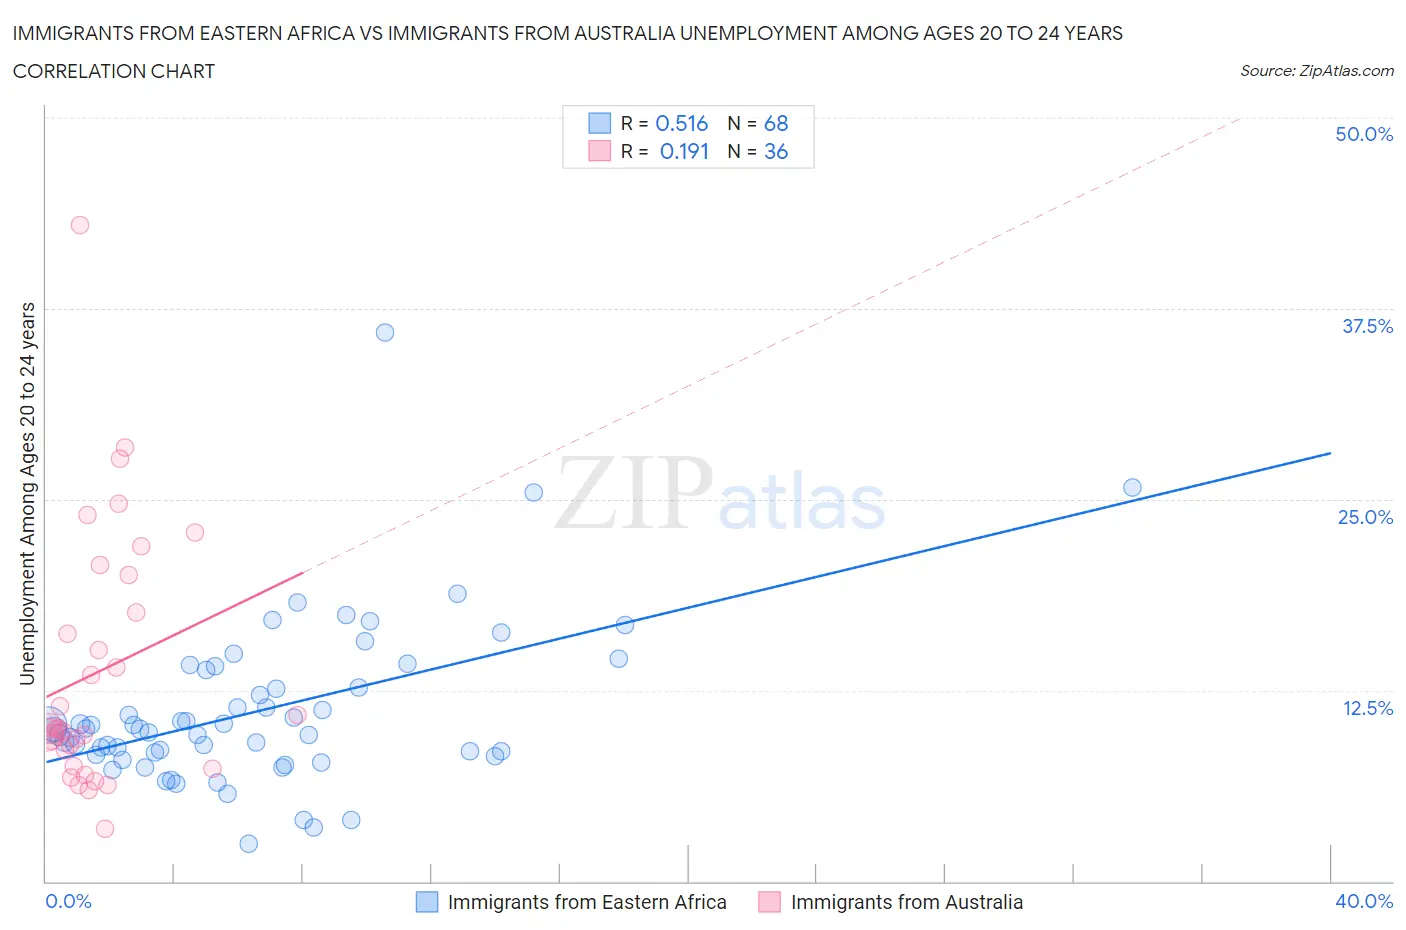
Immigrants from Eastern Africa vs Immigrants from Australia Unemployment Among Ages 20 to 24 years Correlation Chart
The statistical analysis conducted on geographies consisting of 347,814,596 people shows a substantial positive correlation between the proportion of Immigrants from Eastern Africa and unemployment rate among population between the ages 20 and 24 in the United States with a correlation coefficient (R) of 0.516 and weighted average of 9.5%. Similarly, the statistical analysis conducted on geographies consisting of 222,859,842 people shows a poor positive correlation between the proportion of Immigrants from Australia and unemployment rate among population between the ages 20 and 24 in the United States with a correlation coefficient (R) of 0.191 and weighted average of 9.9%, a difference of 3.9%.
Unemployment Among Ages 20 to 24 years Correlation Summary
| Measurement | Immigrants from Eastern Africa | Immigrants from Australia |
| Minimum | 2.5% | 3.4% |
| Maximum | 35.9% | 43.0% |
| Range | 33.4% | 39.6% |
| Mean | 11.1% | 13.7% |
| Median | 9.9% | 10.0% |
| Interquartile 25% (IQ1) | 8.3% | 8.1% |
| Interquartile 75% (IQ3) | 13.3% | 18.8% |
| Interquartile Range (IQR) | 4.9% | 10.8% |
| Standard Deviation (Sample) | 5.4% | 8.4% |
| Standard Deviation (Population) | 5.3% | 8.3% |
Similar Demographics by Unemployment Among Ages 20 to 24 years
Demographics Similar to Immigrants from Eastern Africa by Unemployment Among Ages 20 to 24 years
In terms of unemployment among ages 20 to 24 years, the demographic groups most similar to Immigrants from Eastern Africa are Cambodian (9.5%, a difference of 0.040%), Scandinavian (9.5%, a difference of 0.090%), Immigrants from North Macedonia (9.5%, a difference of 0.10%), Immigrants from Afghanistan (9.5%, a difference of 0.11%), and Australian (9.6%, a difference of 0.16%).
| Demographics | Rating | Rank | Unemployment Among Ages 20 to 24 years |
| Taiwanese | 100.0 /100 | #24 | Exceptional 9.4% |
| Immigrants | Eritrea | 100.0 /100 | #25 | Exceptional 9.5% |
| Swedes | 100.0 /100 | #26 | Exceptional 9.5% |
| Immigrants | Zimbabwe | 100.0 /100 | #27 | Exceptional 9.5% |
| Immigrants | Afghanistan | 100.0 /100 | #28 | Exceptional 9.5% |
| Immigrants | North Macedonia | 100.0 /100 | #29 | Exceptional 9.5% |
| Scandinavians | 100.0 /100 | #30 | Exceptional 9.5% |
| Immigrants | Eastern Africa | 100.0 /100 | #31 | Exceptional 9.5% |
| Cambodians | 100.0 /100 | #32 | Exceptional 9.5% |
| Australians | 100.0 /100 | #33 | Exceptional 9.6% |
| Yugoslavians | 100.0 /100 | #34 | Exceptional 9.6% |
| Germans | 100.0 /100 | #35 | Exceptional 9.6% |
| Belgians | 100.0 /100 | #36 | Exceptional 9.6% |
| Immigrants | Zaire | 100.0 /100 | #37 | Exceptional 9.6% |
| Afghans | 99.9 /100 | #38 | Exceptional 9.6% |
Demographics Similar to Immigrants from Australia by Unemployment Among Ages 20 to 24 years
In terms of unemployment among ages 20 to 24 years, the demographic groups most similar to Immigrants from Australia are Immigrants from Laos (9.9%, a difference of 0.070%), Czechoslovakian (9.9%, a difference of 0.090%), Kenyan (9.9%, a difference of 0.10%), Chickasaw (9.9%, a difference of 0.11%), and Assyrian/Chaldean/Syriac (9.9%, a difference of 0.14%).
| Demographics | Rating | Rank | Unemployment Among Ages 20 to 24 years |
| Mongolians | 99.1 /100 | #68 | Exceptional 9.9% |
| Bulgarians | 99.1 /100 | #69 | Exceptional 9.9% |
| Immigrants | Croatia | 99.0 /100 | #70 | Exceptional 9.9% |
| Celtics | 98.9 /100 | #71 | Exceptional 9.9% |
| Bolivians | 98.9 /100 | #72 | Exceptional 9.9% |
| Kenyans | 98.7 /100 | #73 | Exceptional 9.9% |
| Immigrants | Laos | 98.7 /100 | #74 | Exceptional 9.9% |
| Immigrants | Australia | 98.6 /100 | #75 | Exceptional 9.9% |
| Czechoslovakians | 98.4 /100 | #76 | Exceptional 9.9% |
| Chickasaw | 98.4 /100 | #77 | Exceptional 9.9% |
| Assyrians/Chaldeans/Syriacs | 98.3 /100 | #78 | Exceptional 9.9% |
| Icelanders | 98.3 /100 | #79 | Exceptional 9.9% |
| Immigrants | Netherlands | 98.2 /100 | #80 | Exceptional 9.9% |
| Yaqui | 98.0 /100 | #81 | Exceptional 9.9% |
| Sri Lankans | 98.0 /100 | #82 | Exceptional 9.9% |