Immigrants from China vs Native/Alaskan Unemployment Among Women with Children Ages 6 to 17 years
COMPARE
Immigrants from China
Native/Alaskan
Unemployment Among Women with Children Ages 6 to 17 years
Unemployment Among Women with Children Ages 6 to 17 years Comparison
Immigrants from China
Natives/Alaskans
7.7%
UNEMPLOYMENT AMONG WOMEN WITH CHILDREN AGES 6 TO 17 YEARS
100.0/ 100
METRIC RATING
22nd/ 347
METRIC RANK
11.5%
UNEMPLOYMENT AMONG WOMEN WITH CHILDREN AGES 6 TO 17 YEARS
0.0/ 100
METRIC RATING
333rd/ 347
METRIC RANK
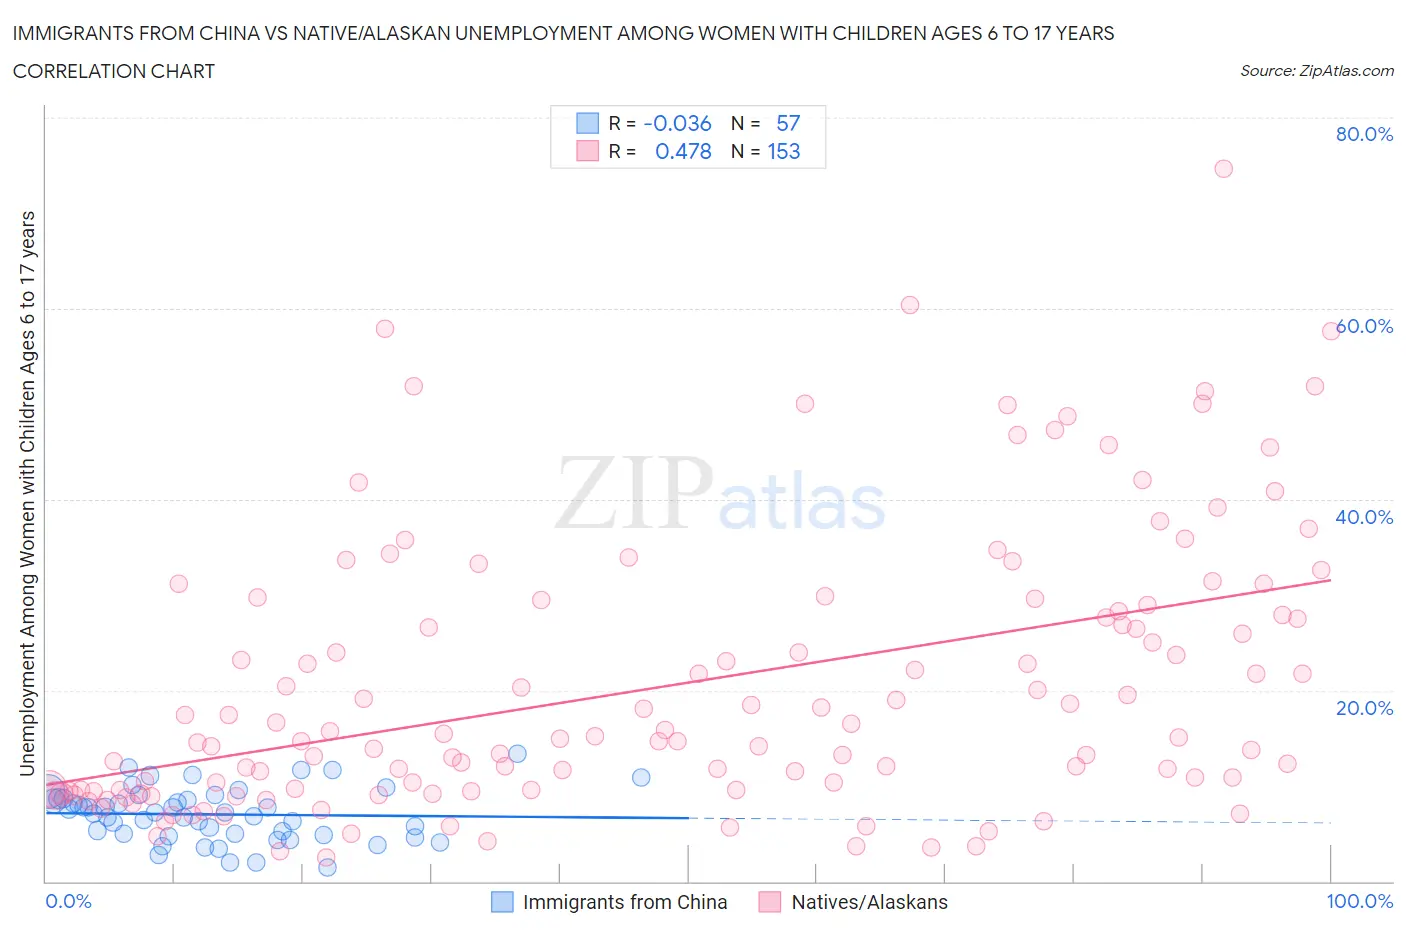
Immigrants from China vs Native/Alaskan Unemployment Among Women with Children Ages 6 to 17 years Correlation Chart
The statistical analysis conducted on geographies consisting of 316,401,640 people shows no correlation between the proportion of Immigrants from China and unemployment rate among women with children between the ages 6 and 17 in the United States with a correlation coefficient (R) of -0.036 and weighted average of 7.7%. Similarly, the statistical analysis conducted on geographies consisting of 344,398,137 people shows a moderate positive correlation between the proportion of Natives/Alaskans and unemployment rate among women with children between the ages 6 and 17 in the United States with a correlation coefficient (R) of 0.478 and weighted average of 11.5%, a difference of 49.1%.
Unemployment Among Women with Children Ages 6 to 17 years Correlation Summary
| Measurement | Immigrants from China | Native/Alaskan |
| Minimum | 1.4% | 2.5% |
| Maximum | 13.3% | 74.6% |
| Range | 11.9% | 72.1% |
| Mean | 7.0% | 20.5% |
| Median | 7.2% | 15.1% |
| Interquartile 25% (IQ1) | 5.0% | 9.5% |
| Interquartile 75% (IQ3) | 8.6% | 28.6% |
| Interquartile Range (IQR) | 3.7% | 19.1% |
| Standard Deviation (Sample) | 2.7% | 14.4% |
| Standard Deviation (Population) | 2.7% | 14.3% |
Similar Demographics by Unemployment Among Women with Children Ages 6 to 17 years
Demographics Similar to Immigrants from China by Unemployment Among Women with Children Ages 6 to 17 years
In terms of unemployment among women with children ages 6 to 17 years, the demographic groups most similar to Immigrants from China are Immigrants from India (7.7%, a difference of 0.29%), Immigrants from Indonesia (7.7%, a difference of 0.38%), Nepalese (7.7%, a difference of 0.39%), Immigrants from Singapore (7.7%, a difference of 0.42%), and Immigrants from Eastern Asia (7.7%, a difference of 0.51%).
| Demographics | Rating | Rank | Unemployment Among Women with Children Ages 6 to 17 years |
| Puget Sound Salish | 100.0 /100 | #15 | Exceptional 7.5% |
| Immigrants | Burma/Myanmar | 100.0 /100 | #16 | Exceptional 7.5% |
| Cambodians | 100.0 /100 | #17 | Exceptional 7.5% |
| Afghans | 100.0 /100 | #18 | Exceptional 7.6% |
| Filipinos | 100.0 /100 | #19 | Exceptional 7.6% |
| Immigrants | Singapore | 100.0 /100 | #20 | Exceptional 7.7% |
| Immigrants | India | 100.0 /100 | #21 | Exceptional 7.7% |
| Immigrants | China | 100.0 /100 | #22 | Exceptional 7.7% |
| Immigrants | Indonesia | 100.0 /100 | #23 | Exceptional 7.7% |
| Nepalese | 100.0 /100 | #24 | Exceptional 7.7% |
| Immigrants | Eastern Asia | 100.0 /100 | #25 | Exceptional 7.7% |
| Indians (Asian) | 100.0 /100 | #26 | Exceptional 7.7% |
| Immigrants | Afghanistan | 100.0 /100 | #27 | Exceptional 7.8% |
| Immigrants | Uzbekistan | 100.0 /100 | #28 | Exceptional 7.8% |
| Thais | 100.0 /100 | #29 | Exceptional 7.8% |
Demographics Similar to Natives/Alaskans by Unemployment Among Women with Children Ages 6 to 17 years
In terms of unemployment among women with children ages 6 to 17 years, the demographic groups most similar to Natives/Alaskans are Tsimshian (11.4%, a difference of 0.63%), Black/African American (11.4%, a difference of 0.74%), Chippewa (11.1%, a difference of 3.4%), Pennsylvania German (11.0%, a difference of 3.9%), and Ugandan (12.0%, a difference of 4.9%).
| Demographics | Rating | Rank | Unemployment Among Women with Children Ages 6 to 17 years |
| Liberians | 0.0 /100 | #326 | Tragic 10.8% |
| Cape Verdeans | 0.0 /100 | #327 | Tragic 10.9% |
| Ottawa | 0.0 /100 | #328 | Tragic 10.9% |
| Pennsylvania Germans | 0.0 /100 | #329 | Tragic 11.0% |
| Chippewa | 0.0 /100 | #330 | Tragic 11.1% |
| Blacks/African Americans | 0.0 /100 | #331 | Tragic 11.4% |
| Tsimshian | 0.0 /100 | #332 | Tragic 11.4% |
| Natives/Alaskans | 0.0 /100 | #333 | Tragic 11.5% |
| Ugandans | 0.0 /100 | #334 | Tragic 12.0% |
| Colville | 0.0 /100 | #335 | Tragic 12.3% |
| Houma | 0.0 /100 | #336 | Tragic 12.5% |
| Immigrants | Yemen | 0.0 /100 | #337 | Tragic 12.7% |
| Hopi | 0.0 /100 | #338 | Tragic 12.9% |
| Sioux | 0.0 /100 | #339 | Tragic 13.2% |
| Puerto Ricans | 0.0 /100 | #340 | Tragic 13.9% |