Immigrants from Chile vs Assyrian/Chaldean/Syriac Unemployment Among Ages 16 to 19 years
COMPARE
Immigrants from Chile
Assyrian/Chaldean/Syriac
Unemployment Among Ages 16 to 19 years
Unemployment Among Ages 16 to 19 years Comparison
Immigrants from Chile
Assyrians/Chaldeans/Syriacs
18.1%
UNEMPLOYMENT AMONG AGES 16 TO 19 YEARS
7.5/ 100
METRIC RATING
225th/ 347
METRIC RANK
17.9%
UNEMPLOYMENT AMONG AGES 16 TO 19 YEARS
20.8/ 100
METRIC RATING
205th/ 347
METRIC RANK
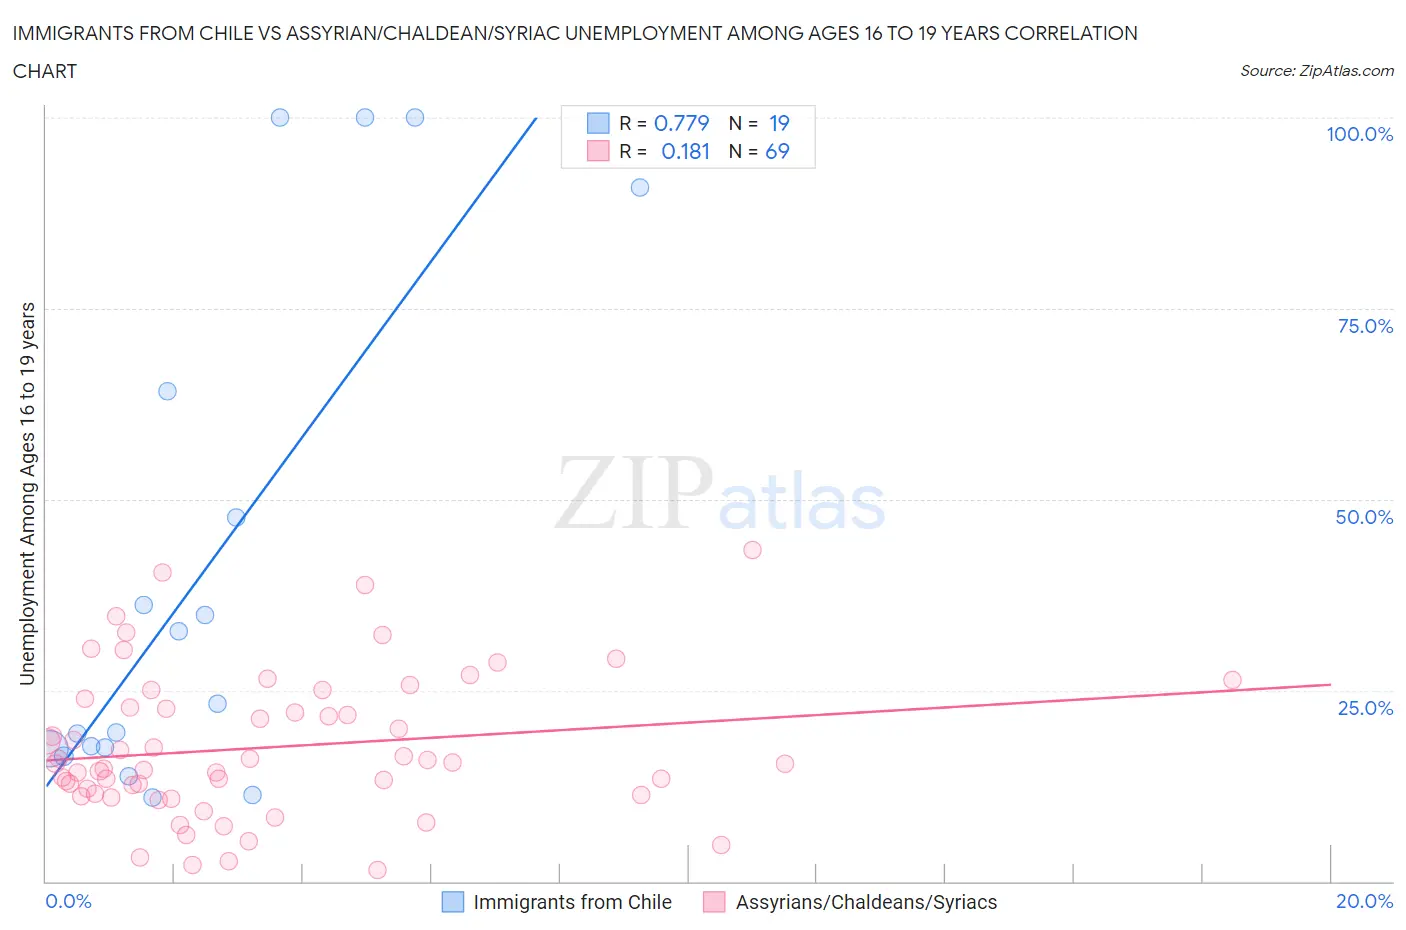
Immigrants from Chile vs Assyrian/Chaldean/Syriac Unemployment Among Ages 16 to 19 years Correlation Chart
The statistical analysis conducted on geographies consisting of 212,816,088 people shows a strong positive correlation between the proportion of Immigrants from Chile and unemployment rate among population between the ages 16 and 19 in the United States with a correlation coefficient (R) of 0.779 and weighted average of 18.1%. Similarly, the statistical analysis conducted on geographies consisting of 108,169,043 people shows a poor positive correlation between the proportion of Assyrians/Chaldeans/Syriacs and unemployment rate among population between the ages 16 and 19 in the United States with a correlation coefficient (R) of 0.181 and weighted average of 17.9%, a difference of 1.4%.
Unemployment Among Ages 16 to 19 years Correlation Summary
| Measurement | Immigrants from Chile | Assyrian/Chaldean/Syriac |
| Minimum | 11.0% | 1.5% |
| Maximum | 100.0% | 43.4% |
| Range | 89.0% | 41.9% |
| Mean | 40.7% | 17.5% |
| Median | 23.3% | 15.4% |
| Interquartile 25% (IQ1) | 17.3% | 11.4% |
| Interquartile 75% (IQ3) | 64.1% | 23.3% |
| Interquartile Range (IQR) | 46.9% | 11.9% |
| Standard Deviation (Sample) | 33.1% | 9.3% |
| Standard Deviation (Population) | 32.2% | 9.3% |
Demographics Similar to Immigrants from Chile and Assyrians/Chaldeans/Syriacs by Unemployment Among Ages 16 to 19 years
In terms of unemployment among ages 16 to 19 years, the demographic groups most similar to Immigrants from Chile are Immigrants from Serbia (18.1%, a difference of 0.12%), Immigrants from Western Asia (18.0%, a difference of 0.39%), Immigrants from Iran (18.0%, a difference of 0.44%), Immigrants from Albania (18.0%, a difference of 0.53%), and Immigrants from Spain (18.0%, a difference of 0.53%). Similarly, the demographic groups most similar to Assyrians/Chaldeans/Syriacs are Immigrants from Southern Europe (17.9%, a difference of 0.14%), Liberian (17.9%, a difference of 0.16%), Hawaiian (17.9%, a difference of 0.31%), Cherokee (17.9%, a difference of 0.39%), and Carpatho Rusyn (17.9%, a difference of 0.41%).
| Demographics | Rating | Rank | Unemployment Among Ages 16 to 19 years |
| Assyrians/Chaldeans/Syriacs | 20.8 /100 | #205 | Fair 17.9% |
| Immigrants | Southern Europe | 18.9 /100 | #206 | Poor 17.9% |
| Liberians | 18.6 /100 | #207 | Poor 17.9% |
| Hawaiians | 16.8 /100 | #208 | Poor 17.9% |
| Cherokee | 15.7 /100 | #209 | Poor 17.9% |
| Carpatho Rusyns | 15.6 /100 | #210 | Poor 17.9% |
| Guamanians/Chamorros | 14.5 /100 | #211 | Poor 17.9% |
| Argentineans | 13.8 /100 | #212 | Poor 18.0% |
| Chippewa | 13.7 /100 | #213 | Poor 18.0% |
| Immigrants | Morocco | 13.5 /100 | #214 | Poor 18.0% |
| Immigrants | Syria | 13.3 /100 | #215 | Poor 18.0% |
| Immigrants | Kazakhstan | 13.0 /100 | #216 | Poor 18.0% |
| South American Indians | 13.0 /100 | #217 | Poor 18.0% |
| Immigrants | Argentina | 12.5 /100 | #218 | Poor 18.0% |
| Immigrants | Africa | 12.0 /100 | #219 | Poor 18.0% |
| Immigrants | Albania | 11.4 /100 | #220 | Poor 18.0% |
| Immigrants | Spain | 11.4 /100 | #221 | Poor 18.0% |
| Immigrants | Iran | 10.7 /100 | #222 | Poor 18.0% |
| Immigrants | Western Asia | 10.2 /100 | #223 | Poor 18.0% |
| Immigrants | Serbia | 8.3 /100 | #224 | Tragic 18.1% |
| Immigrants | Chile | 7.5 /100 | #225 | Tragic 18.1% |