Immigrants from Chile vs Assyrian/Chaldean/Syriac Disability Age 18 to 34
COMPARE
Immigrants from Chile
Assyrian/Chaldean/Syriac
Disability Age 18 to 34
Disability Age 18 to 34 Comparison
Immigrants from Chile
Assyrians/Chaldeans/Syriacs
6.1%
DISABILITY AGE 18 TO 34
98.5/ 100
METRIC RATING
80th/ 347
METRIC RANK
6.1%
DISABILITY AGE 18 TO 34
98.9/ 100
METRIC RATING
78th/ 347
METRIC RANK
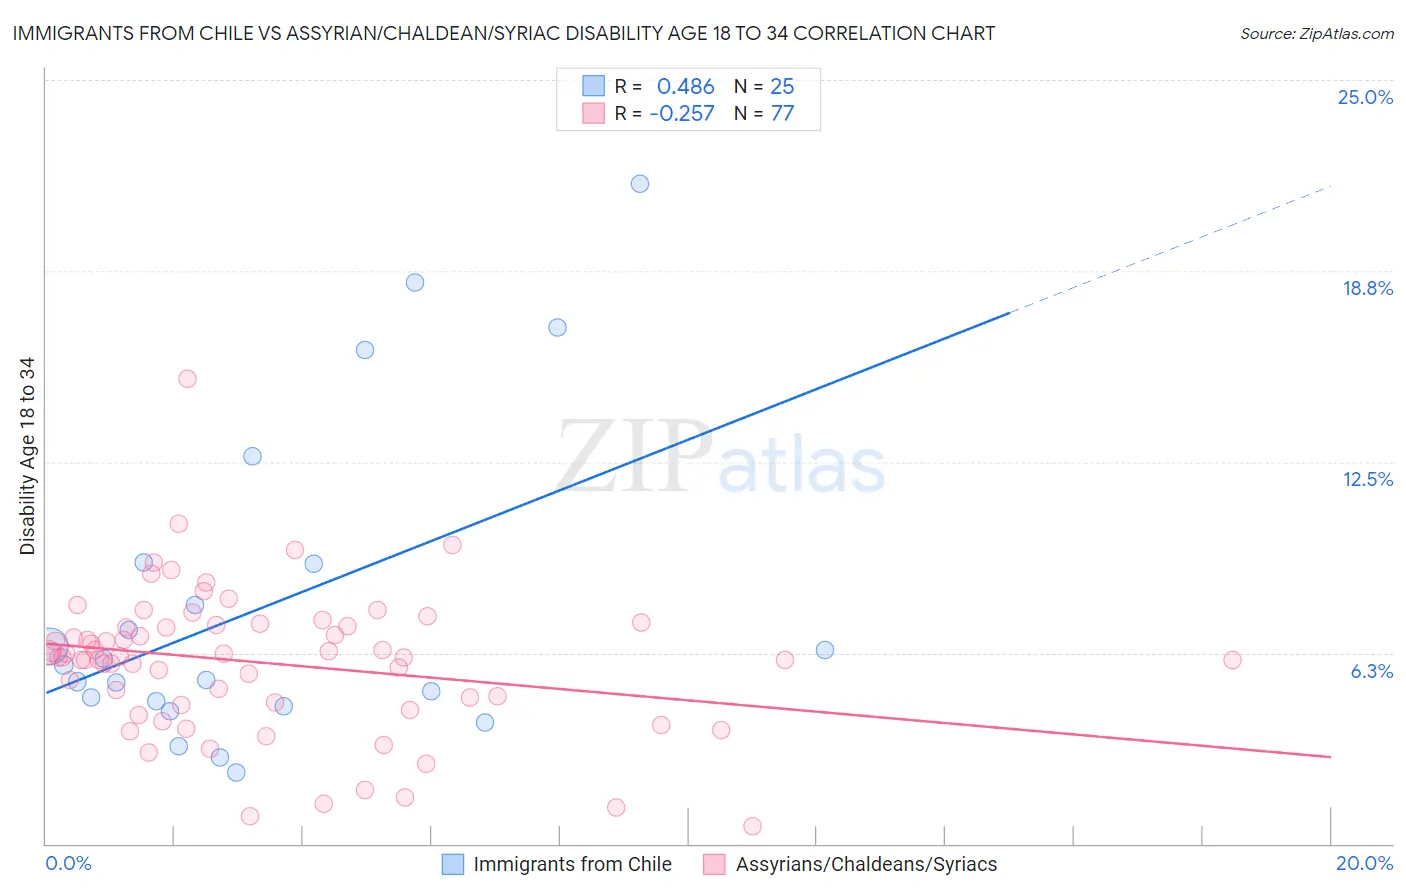
Immigrants from Chile vs Assyrian/Chaldean/Syriac Disability Age 18 to 34 Correlation Chart
The statistical analysis conducted on geographies consisting of 218,467,442 people shows a moderate positive correlation between the proportion of Immigrants from Chile and percentage of population with a disability between the ages 18 and 35 in the United States with a correlation coefficient (R) of 0.486 and weighted average of 6.1%. Similarly, the statistical analysis conducted on geographies consisting of 110,269,916 people shows a weak negative correlation between the proportion of Assyrians/Chaldeans/Syriacs and percentage of population with a disability between the ages 18 and 35 in the United States with a correlation coefficient (R) of -0.257 and weighted average of 6.1%, a difference of 0.49%.
Disability Age 18 to 34 Correlation Summary
| Measurement | Immigrants from Chile | Assyrian/Chaldean/Syriac |
| Minimum | 2.3% | 0.58% |
| Maximum | 21.6% | 15.2% |
| Range | 19.3% | 14.6% |
| Mean | 7.8% | 5.9% |
| Median | 5.8% | 6.1% |
| Interquartile 25% (IQ1) | 4.6% | 4.6% |
| Interquartile 75% (IQ3) | 9.2% | 7.1% |
| Interquartile Range (IQR) | 4.6% | 2.5% |
| Standard Deviation (Sample) | 5.2% | 2.4% |
| Standard Deviation (Population) | 5.1% | 2.3% |
Demographics Similar to Immigrants from Chile and Assyrians/Chaldeans/Syriacs by Disability Age 18 to 34
In terms of disability age 18 to 34, the demographic groups most similar to Immigrants from Chile are Immigrants from Australia (6.1%, a difference of 0.040%), Afghan (6.1%, a difference of 0.19%), Immigrants from Northern Africa (6.1%, a difference of 0.22%), Barbadian (6.1%, a difference of 0.29%), and Israeli (6.1%, a difference of 0.32%). Similarly, the demographic groups most similar to Assyrians/Chaldeans/Syriacs are Immigrants from Russia (6.1%, a difference of 0.0%), Immigrants from Western Asia (6.1%, a difference of 0.10%), Afghan (6.1%, a difference of 0.29%), Immigrants from Turkey (6.1%, a difference of 0.38%), and Immigrants from Australia (6.1%, a difference of 0.53%).
| Demographics | Rating | Rank | Disability Age 18 to 34 |
| Immigrants | West Indies | 99.4 /100 | #69 | Exceptional 6.0% |
| Immigrants | Greece | 99.4 /100 | #70 | Exceptional 6.0% |
| Immigrants | Japan | 99.3 /100 | #71 | Exceptional 6.0% |
| Immigrants | Lebanon | 99.2 /100 | #72 | Exceptional 6.0% |
| Cypriots | 99.2 /100 | #73 | Exceptional 6.0% |
| Haitians | 99.2 /100 | #74 | Exceptional 6.0% |
| Immigrants | Turkey | 99.1 /100 | #75 | Exceptional 6.1% |
| Immigrants | Western Asia | 98.9 /100 | #76 | Exceptional 6.1% |
| Immigrants | Russia | 98.9 /100 | #77 | Exceptional 6.1% |
| Assyrians/Chaldeans/Syriacs | 98.9 /100 | #78 | Exceptional 6.1% |
| Afghans | 98.7 /100 | #79 | Exceptional 6.1% |
| Immigrants | Chile | 98.5 /100 | #80 | Exceptional 6.1% |
| Immigrants | Australia | 98.5 /100 | #81 | Exceptional 6.1% |
| Immigrants | Northern Africa | 98.4 /100 | #82 | Exceptional 6.1% |
| Barbadians | 98.3 /100 | #83 | Exceptional 6.1% |
| Israelis | 98.3 /100 | #84 | Exceptional 6.1% |
| Immigrants | Ireland | 98.2 /100 | #85 | Exceptional 6.1% |
| Immigrants | Kuwait | 98.0 /100 | #86 | Exceptional 6.2% |
| Immigrants | Eastern Europe | 97.9 /100 | #87 | Exceptional 6.2% |
| Cambodians | 97.8 /100 | #88 | Exceptional 6.2% |
| Turks | 97.8 /100 | #89 | Exceptional 6.2% |