Immigrants from Cambodia vs Potawatomi Unemployment Among Youth under 25 years
COMPARE
Immigrants from Cambodia
Potawatomi
Unemployment Among Youth under 25 years
Unemployment Among Youth under 25 years Comparison
Immigrants from Cambodia
Potawatomi
11.5%
UNEMPLOYMENT AMONG YOUTH UNDER 25 YEARS
71.8/ 100
METRIC RATING
149th/ 347
METRIC RANK
11.6%
UNEMPLOYMENT AMONG YOUTH UNDER 25 YEARS
57.9/ 100
METRIC RATING
168th/ 347
METRIC RANK
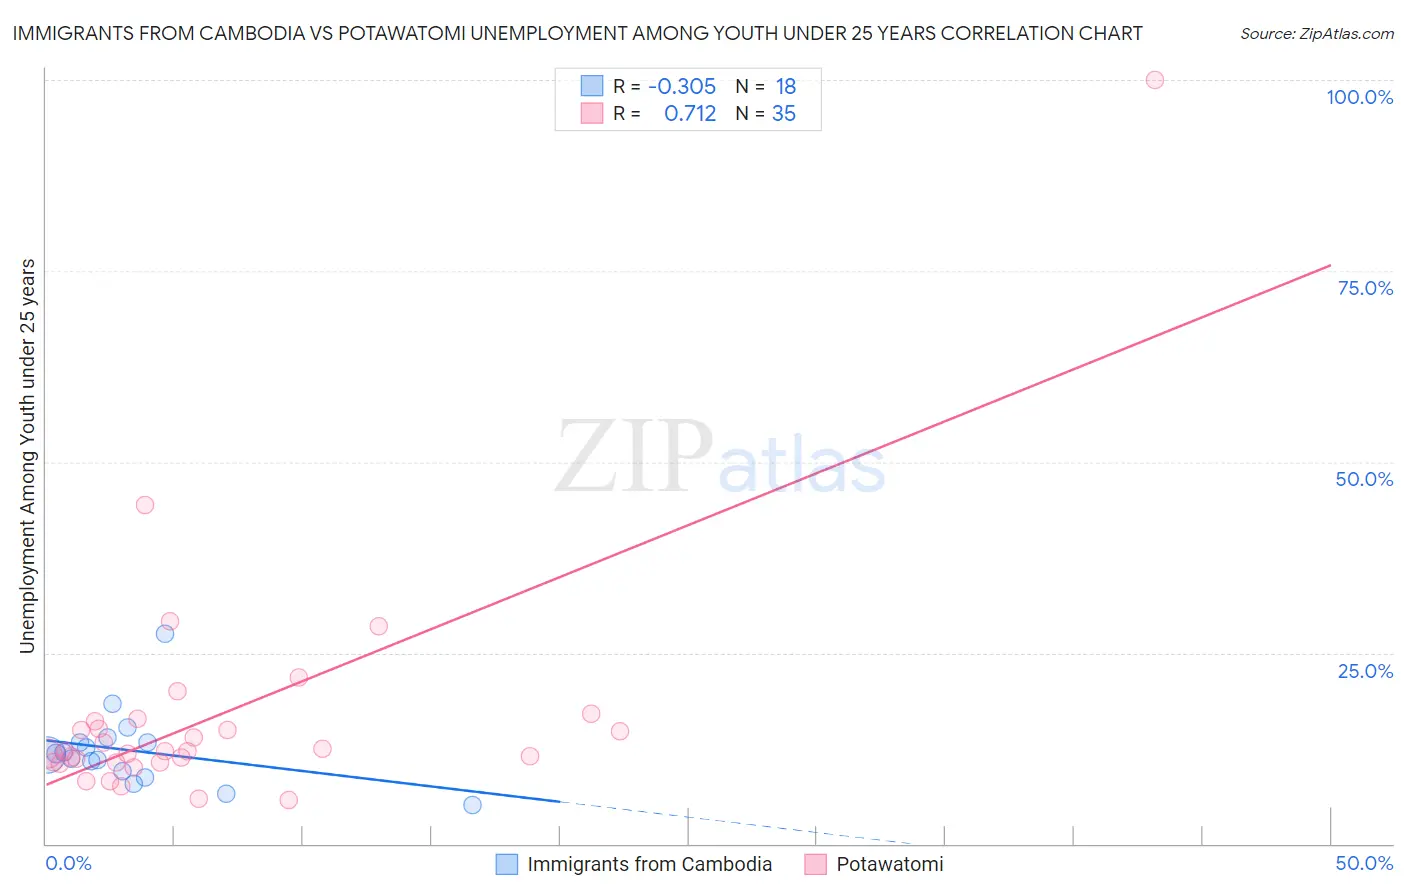
Immigrants from Cambodia vs Potawatomi Unemployment Among Youth under 25 years Correlation Chart
The statistical analysis conducted on geographies consisting of 204,519,643 people shows a mild negative correlation between the proportion of Immigrants from Cambodia and unemployment rate among youth under the age of 25 in the United States with a correlation coefficient (R) of -0.305 and weighted average of 11.5%. Similarly, the statistical analysis conducted on geographies consisting of 117,120,602 people shows a strong positive correlation between the proportion of Potawatomi and unemployment rate among youth under the age of 25 in the United States with a correlation coefficient (R) of 0.712 and weighted average of 11.6%, a difference of 0.64%.
Unemployment Among Youth under 25 years Correlation Summary
| Measurement | Immigrants from Cambodia | Potawatomi |
| Minimum | 5.1% | 5.8% |
| Maximum | 27.5% | 100.0% |
| Range | 22.4% | 94.2% |
| Mean | 12.2% | 16.7% |
| Median | 11.7% | 12.2% |
| Interquartile 25% (IQ1) | 9.5% | 10.6% |
| Interquartile 75% (IQ3) | 13.3% | 16.1% |
| Interquartile Range (IQR) | 3.8% | 5.4% |
| Standard Deviation (Sample) | 4.9% | 16.2% |
| Standard Deviation (Population) | 4.8% | 16.0% |
Demographics Similar to Immigrants from Cambodia and Potawatomi by Unemployment Among Youth under 25 years
In terms of unemployment among youth under 25 years, the demographic groups most similar to Immigrants from Cambodia are Immigrants from Northern Europe (11.5%, a difference of 0.010%), Immigrants from Switzerland (11.5%, a difference of 0.010%), Uruguayan (11.5%, a difference of 0.070%), Iraqi (11.5%, a difference of 0.17%), and Immigrants from Czechoslovakia (11.5%, a difference of 0.23%). Similarly, the demographic groups most similar to Potawatomi are Okinawan (11.6%, a difference of 0.040%), Spanish (11.6%, a difference of 0.11%), Immigrants from Sweden (11.5%, a difference of 0.15%), Immigrants from Laos (11.5%, a difference of 0.20%), and Immigrants from Northern Africa (11.5%, a difference of 0.21%).
| Demographics | Rating | Rank | Unemployment Among Youth under 25 years |
| Immigrants | Northern Europe | 72.1 /100 | #148 | Good 11.5% |
| Immigrants | Cambodia | 71.8 /100 | #149 | Good 11.5% |
| Immigrants | Switzerland | 71.6 /100 | #150 | Good 11.5% |
| Uruguayans | 70.4 /100 | #151 | Good 11.5% |
| Iraqis | 68.3 /100 | #152 | Good 11.5% |
| Immigrants | Czechoslovakia | 67.1 /100 | #153 | Good 11.5% |
| Immigrants | Asia | 66.7 /100 | #154 | Good 11.5% |
| Immigrants | Romania | 66.3 /100 | #155 | Good 11.5% |
| Immigrants | Germany | 65.9 /100 | #156 | Good 11.5% |
| Indians (Asian) | 65.1 /100 | #157 | Good 11.5% |
| Immigrants | Turkey | 64.8 /100 | #158 | Good 11.5% |
| Immigrants | Western Europe | 64.7 /100 | #159 | Good 11.5% |
| Immigrants | Eastern Asia | 64.5 /100 | #160 | Good 11.5% |
| Ukrainians | 64.3 /100 | #161 | Good 11.5% |
| Immigrants | Northern Africa | 62.7 /100 | #162 | Good 11.5% |
| Immigrants | Kazakhstan | 62.7 /100 | #163 | Good 11.5% |
| Immigrants | Laos | 62.4 /100 | #164 | Good 11.5% |
| Immigrants | Sweden | 61.3 /100 | #165 | Good 11.5% |
| Spanish | 60.3 /100 | #166 | Good 11.6% |
| Okinawans | 58.7 /100 | #167 | Average 11.6% |
| Potawatomi | 57.9 /100 | #168 | Average 11.6% |