Immigrants from Cambodia vs Luxembourger Unemployment Among Youth under 25 years

COMPARE

Immigrants from Cambodia
Race
Ancestry
AfghanAfricanAlaska NativeAlaskan AthabascanAlbanianAleutAlsatianAmericanApacheArabArapahoArgentineanArmenianAssyrian/Chaldean/SyriacAustralianAustrianBahamianBangladeshiBarbadianBasqueBelgianBelizeanBermudanBhutaneseBlackfeetBolivianBrazilianBritishBritish West IndianBulgarianBurmeseCajunCambodianCanadianCape VerdeanCarpatho RusynCelticCentral AmericanCentral American IndianCherokeeCheyenneChickasawChileanChineseChippewaChoctawColombianColvilleComancheCosta RicanCreeCreekCroatianCrowCubanCypriotCzechCzechoslovakianDanishDelawareDominicanDutchDutch West IndianEastern EuropeanEcuadorianEgyptianEnglishEstonianEthiopianEuropeanFijianFilipinoFinnishFrenchFrench American IndianFrench CanadianGermanGerman RussianGhanaianGreekGuamanian/ChamorroGuatemalanGuyaneseHaitianHmongHonduranHopiHoumaHungarianIcelanderIndian (Asian)IndonesianInupiatIranianIraqiIrishIroquoisIsraeliItalianJamaicanJapaneseJordanianKenyanKiowaKoreanLaotianLatvianLebaneseLiberianLithuanianLumbeeMacedonianMalaysianMalteseMarshalleseMenomineeMexicanMexican American IndianMongolianMoroccanNative HawaiianNavajoNepaleseNew ZealanderNicaraguanNigerianNorthern EuropeanNorwegianOkinawanOsageOttawaPaiutePakistaniPalestinianPanamanianParaguayanPennsylvania GermanPeruvianPimaPolishPortuguesePotawatomiPuebloPuerto RicanPuget Sound SalishRomanianRussianSalvadoranSamoanScandinavianScotch-IrishScottishSeminoleSenegaleseSerbianShoshoneSierra LeoneanSiouxSlavicSlovakSloveneSomaliSouth AfricanSouth AmericanSouth American IndianSoviet UnionSpaniardSpanishSpanish AmericanSpanish American IndianSri LankanSubsaharan AfricanSudaneseSwedishSwissSyrianTaiwaneseThaiTlingit-HaidaTohono O'OdhamTonganTrinidadian and TobagonianTsimshianTurkishU.S. Virgin IslanderUgandanUkrainianUruguayanUteVenezuelanVietnameseWelshWest IndianYakamaYaquiYugoslavianYumanYup'ikZimbabwean
Immigration
NonimmigrantsImmigrantsAfghanistanAfricaAlbaniaArgentinaArmeniaAsiaAustraliaAustriaBahamasBangladeshBarbadosBelarusBelgiumBelizeBoliviaBosnia and HerzegovinaBrazilBulgariaBurma/MyanmarCabo VerdeCambodiaCameroonCanadaCaribbeanCentral AmericaChileChinaColombiaCongoCosta RicaCroatiaCubaCzechoslovakiaDenmarkDominicaDominican RepublicEastern AfricaEastern AsiaEastern EuropeEcuadorEgyptEl SalvadorEnglandEritreaEthiopiaEuropeFijiFranceGermanyGhanaGreeceGrenadaGuatemalaGuyanaHaitiHondurasHong KongHungaryIndiaIndonesiaIranIraqIrelandIsraelItalyJamaicaJapanJordanKazakhstanKenyaKoreaKuwaitLaosLatin AmericaLatviaLebanonLiberiaLithuaniaMalaysiaMexicoMicronesiaMiddle AfricaMoldovaMoroccoNepalNetherlandsNicaraguaNigeriaNorth AmericaNorth MacedoniaNorthern AfricaNorthern EuropeNorwayOceaniaPakistanPanamaPeruPhilippinesPolandPortugalRomaniaRussiaSaudi ArabiaScotlandSenegalSerbiaSierra LeoneSingaporeSomaliaSouth AfricaSouth AmericaSouth Central AsiaSouth Eastern AsiaSouthern EuropeSpainSri LankaSt. Vincent and the GrenadinesSudanSwedenSwitzerlandSyriaTaiwanThailandTrinidad and TobagoTurkeyUgandaUkraineUruguayUzbekistanVenezuelaVietnamWest IndiesWestern AfricaWestern AsiaWestern EuropeYemenZaireZimbabweAzores
Luxembourger
Race
Ancestry
AfghanAfricanAlaska NativeAlaskan AthabascanAlbanianAleutAlsatianAmericanApacheArabArapahoArgentineanArmenianAssyrian/Chaldean/SyriacAustralianAustrianBahamianBangladeshiBarbadianBasqueBelgianBelizeanBermudanBhutaneseBlackfeetBolivianBrazilianBritishBritish West IndianBulgarianBurmeseCajunCambodianCanadianCape VerdeanCarpatho RusynCelticCentral AmericanCentral American IndianCherokeeCheyenneChickasawChileanChineseChippewaChoctawColombianColvilleComancheCosta RicanCreeCreekCroatianCrowCubanCypriotCzechCzechoslovakianDanishDelawareDominicanDutchDutch West IndianEastern EuropeanEcuadorianEgyptianEnglishEstonianEthiopianEuropeanFijianFilipinoFinnishFrenchFrench American IndianFrench CanadianGermanGerman RussianGhanaianGreekGuamanian/ChamorroGuatemalanGuyaneseHaitianHmongHonduranHopiHoumaHungarianIcelanderIndian (Asian)IndonesianInupiatIranianIraqiIrishIroquoisIsraeliItalianJamaicanJapaneseJordanianKenyanKiowaKoreanLaotianLatvianLebaneseLiberianLithuanianLumbeeLuxembourgerMacedonianMalaysianMalteseMarshalleseMenomineeMexicanMexican American IndianMongolianMoroccanNative HawaiianNavajoNepaleseNew ZealanderNicaraguanNigerianNorthern EuropeanNorwegianOkinawanOsageOttawaPaiutePakistaniPalestinianPanamanianParaguayanPennsylvania GermanPeruvianPimaPolishPortuguesePotawatomiPuebloPuerto RicanPuget Sound SalishRomanianRussianSalvadoranSamoanScandinavianScotch-IrishScottishSeminoleSenegaleseSerbianShoshoneSierra LeoneanSiouxSlavicSlovakSloveneSomaliSouth AfricanSouth AmericanSouth American IndianSoviet UnionSpaniardSpanishSpanish AmericanSpanish American IndianSri LankanSubsaharan AfricanSudaneseSwedishSwissSyrianTaiwaneseThaiTlingit-HaidaTohono O'OdhamTonganTrinidadian and TobagonianTsimshianTurkishU.S. Virgin IslanderUgandanUkrainianUruguayanUteVenezuelanVietnameseWelshWest IndianYakamaYaquiYugoslavianYumanYup'ikZimbabwean
Immigration
NonimmigrantsImmigrantsAfghanistanAfricaAlbaniaArgentinaArmeniaAsiaAustraliaAustriaBahamasBangladeshBarbadosBelarusBelgiumBelizeBoliviaBosnia and HerzegovinaBrazilBulgariaBurma/MyanmarCabo VerdeCameroonCanadaCaribbeanCentral AmericaChileChinaColombiaCongoCosta RicaCroatiaCubaCzechoslovakiaDenmarkDominicaDominican RepublicEastern AfricaEastern AsiaEastern EuropeEcuadorEgyptEl SalvadorEnglandEritreaEthiopiaEuropeFijiFranceGermanyGhanaGreeceGrenadaGuatemalaGuyanaHaitiHondurasHong KongHungaryIndiaIndonesiaIranIraqIrelandIsraelItalyJamaicaJapanJordanKazakhstanKenyaKoreaKuwaitLaosLatin AmericaLatviaLebanonLiberiaLithuaniaMalaysiaMexicoMicronesiaMiddle AfricaMoldovaMoroccoNepalNetherlandsNicaraguaNigeriaNorth AmericaNorth MacedoniaNorthern AfricaNorthern EuropeNorwayOceaniaPakistanPanamaPeruPhilippinesPolandPortugalRomaniaRussiaSaudi ArabiaScotlandSenegalSerbiaSierra LeoneSingaporeSomaliaSouth AfricaSouth AmericaSouth Central AsiaSouth Eastern AsiaSouthern EuropeSpainSri LankaSt. Vincent and the GrenadinesSudanSwedenSwitzerlandSyriaTaiwanThailandTrinidad and TobagoTurkeyUgandaUkraineUruguayUzbekistanVenezuelaVietnamWest IndiesWestern AfricaWestern AsiaWestern EuropeYemenZaireZimbabweAzores
Unemployment Among Youth under 25 years
Income
Poverty
Unemployment
Labor Participation
Family Structure
Vehicle Availability
Education Level
Disability

Unemployment Among Youth under 25 years Comparison

Immigrants from Cambodia

Luxembourgers

Good
Exceptional
11.5%
UNEMPLOYMENT AMONG YOUTH UNDER 25 YEARS
71.8/ 100
METRIC RATING
149th/ 347
METRIC RANK
10.0%
UNEMPLOYMENT AMONG YOUTH UNDER 25 YEARS
100.0/ 100
METRIC RATING
3rd/ 347
METRIC RANK

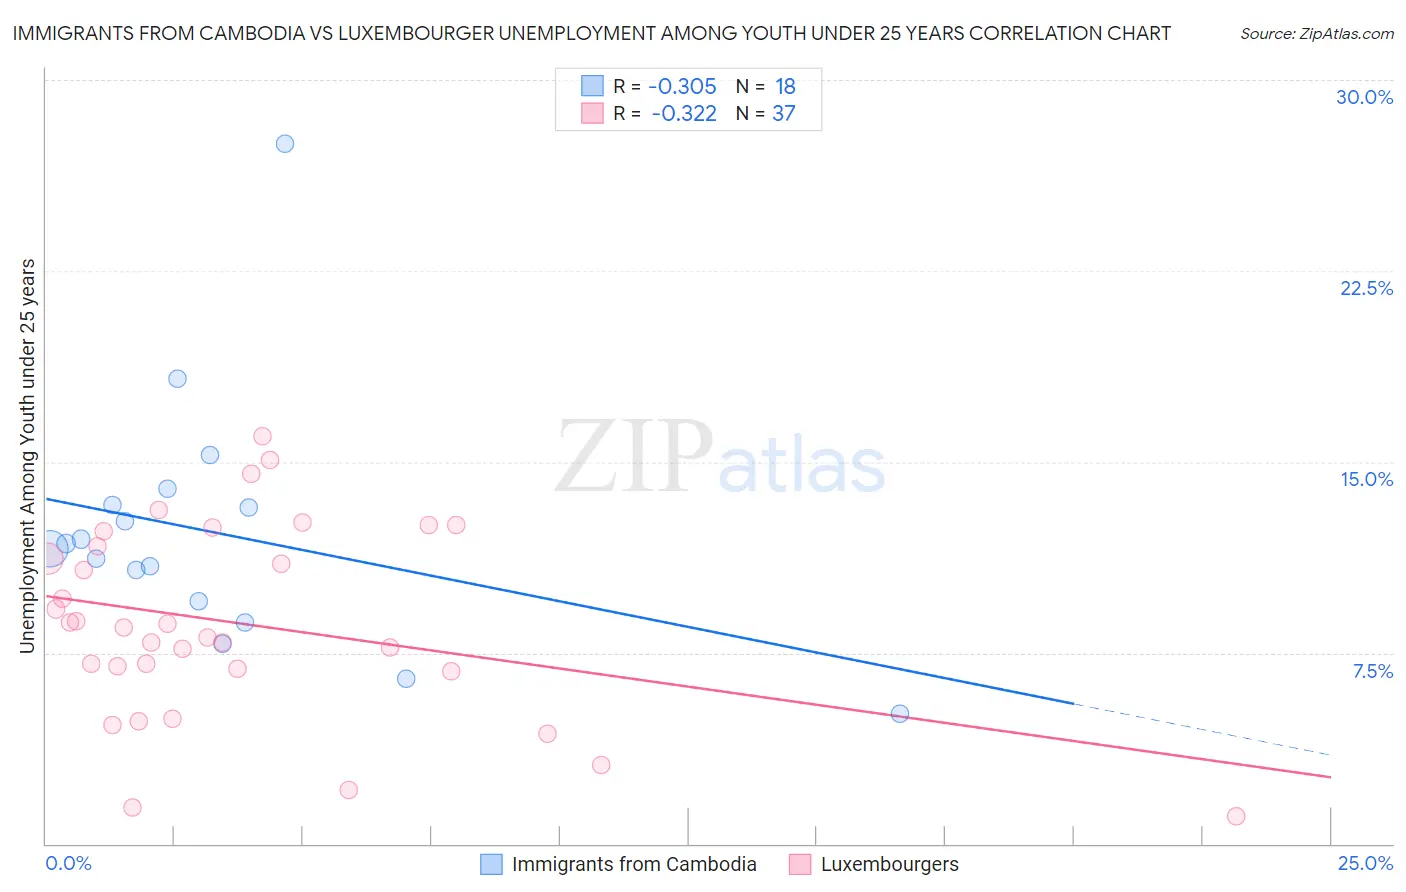
Immigrants from Cambodia vs Luxembourger Unemployment Among Youth under 25 years Correlation Chart

The statistical analysis conducted on geographies consisting of 204,519,643 people shows a mild negative correlation between the proportion of Immigrants from Cambodia and unemployment rate among youth under the age of 25 in the United States with a correlation coefficient (R) of -0.305 and weighted average of 11.5%. Similarly, the statistical analysis conducted on geographies consisting of 143,473,980 people shows a mild negative correlation between the proportion of Luxembourgers and unemployment rate among youth under the age of 25 in the United States with a correlation coefficient (R) of -0.322 and weighted average of 10.0%, a difference of 14.6%.
Immigrants from Cambodia vs Luxembourger Unemployment Among Youth under 25 years

Unemployment Among Youth under 25 years Correlation Summary

MeasurementImmigrants from CambodiaLuxembourger
Minimum5.1%1.1%
Maximum27.5%16.0%
Range22.4%14.9%
Mean12.2%8.6%
Median11.7%8.5%
Interquartile 25% (IQ1)9.5%6.8%
Interquartile 75% (IQ3)13.3%12.0%
Interquartile Range (IQR)3.8%5.1%
Standard Deviation (Sample)4.9%3.8%
Standard Deviation (Population)4.8%3.7%

Similar Demographics by Unemployment Among Youth under 25 years

Demographics Similar to Immigrants from Cambodia by Unemployment Among Youth under 25 years

In terms of unemployment among youth under 25 years, the demographic groups most similar to Immigrants from Cambodia are Immigrants from Northern Europe (11.5%, a difference of 0.010%), Immigrants from Switzerland (11.5%, a difference of 0.010%), Laotian (11.5%, a difference of 0.030%), Brazilian (11.5%, a difference of 0.040%), and Argentinean (11.5%, a difference of 0.060%).
DemographicsRating | RankUnemployment Among Youth under 25 years
Immigrants | Korea
75.1
/100
|
#142
Good
11.5%
Immigrants | Uganda
74.5
/100
|
#143
Good
11.5%
Immigrants | Brazil
74.3
/100
|
#144
Good
11.5%
Argentineans
73.0
/100
|
#145
Good
11.5%
Brazilians
72.5
/100
|
#146
Good
11.5%
Laotians
72.4
/100
|
#147
Good
11.5%
Immigrants | Northern Europe
72.1
/100
|
#148
Good
11.5%
Immigrants | Cambodia
71.8
/100
|
#149
Good
11.5%
Immigrants | Switzerland
71.6
/100
|
#150
Good
11.5%
Uruguayans
70.4
/100
|
#151
Good
11.5%
Iraqis
68.3
/100
|
#152
Good
11.5%
Immigrants | Czechoslovakia
67.1
/100
|
#153
Good
11.5%
Immigrants | Asia
66.7
/100
|
#154
Good
11.5%
Immigrants | Romania
66.3
/100
|
#155
Good
11.5%
Immigrants | Germany
65.9
/100
|
#156
Good
11.5%

Demographics Similar to Luxembourgers by Unemployment Among Youth under 25 years

In terms of unemployment among youth under 25 years, the demographic groups most similar to Luxembourgers are Immigrants from Cuba (10.0%, a difference of 0.28%), Zimbabwean (10.2%, a difference of 1.6%), Norwegian (9.8%, a difference of 1.8%), Czech (10.3%, a difference of 2.7%), and Danish (10.3%, a difference of 2.9%).
DemographicsRating | RankUnemployment Among Youth under 25 years
Norwegians
100.0
/100
|
#1
Exceptional
9.8%
Immigrants | Cuba
100.0
/100
|
#2
Exceptional
10.0%
Luxembourgers
100.0
/100
|
#3
Exceptional
10.0%
Zimbabweans
100.0
/100
|
#4
Exceptional
10.2%
Czechs
100.0
/100
|
#5
Exceptional
10.3%
Danes
100.0
/100
|
#6
Exceptional
10.3%
Swedes
100.0
/100
|
#7
Exceptional
10.4%
Immigrants | Venezuela
100.0
/100
|
#8
Exceptional
10.5%
Germans
100.0
/100
|
#9
Exceptional
10.5%
Immigrants | Somalia
100.0
/100
|
#10
Exceptional
10.5%
Scandinavians
100.0
/100
|
#11
Exceptional
10.5%
Immigrants | Sudan
100.0
/100
|
#12
Exceptional
10.5%
Indonesians
100.0
/100
|
#13
Exceptional
10.6%
Cubans
100.0
/100
|
#14
Exceptional
10.6%
Sudanese
100.0
/100
|
#15
Exceptional
10.6%